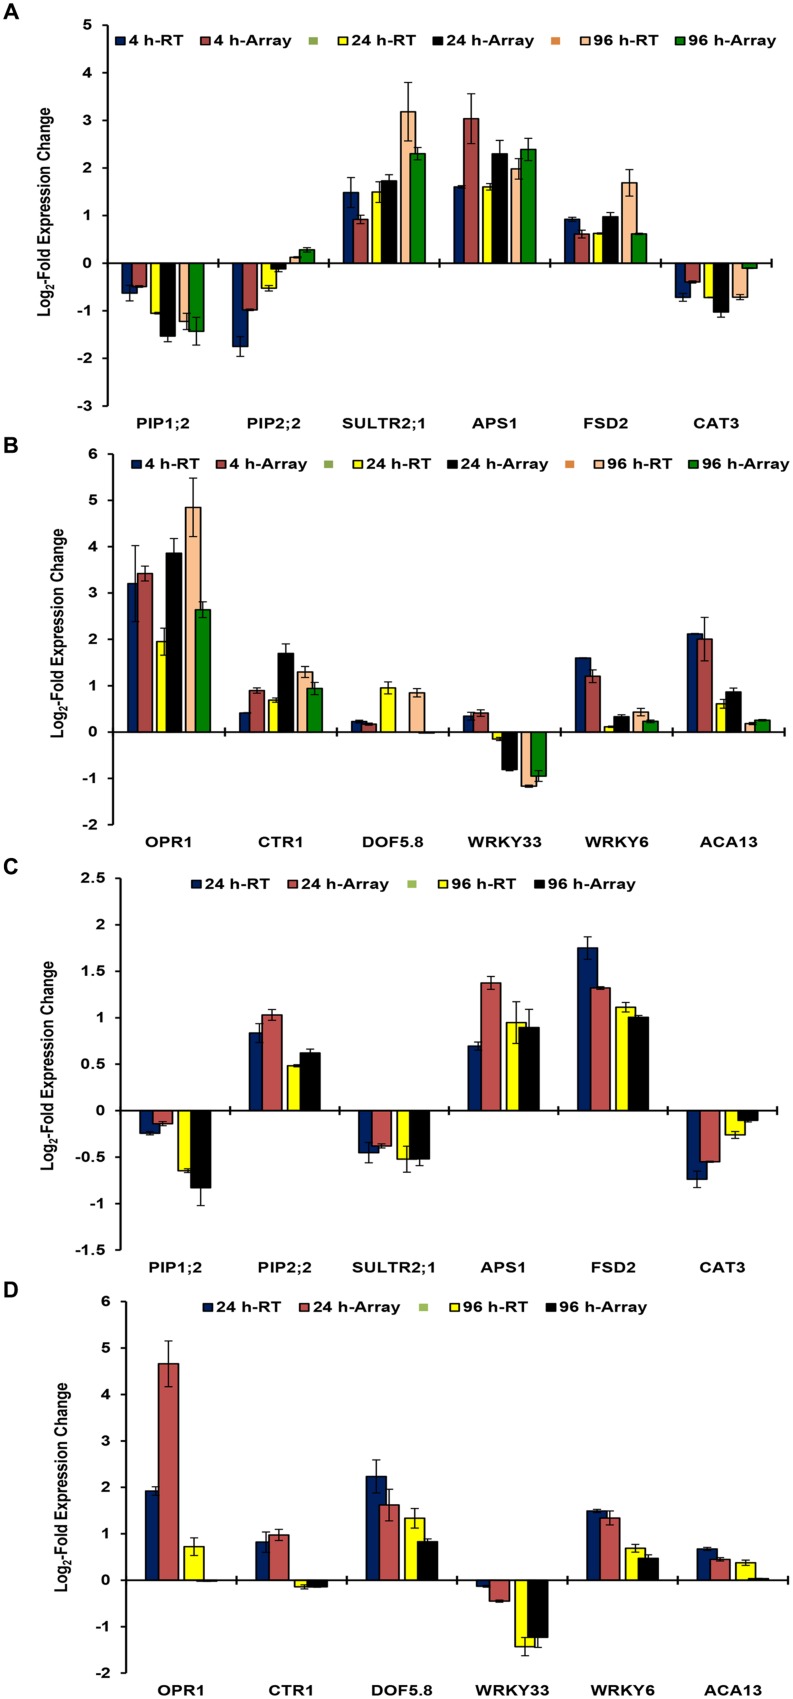
FIGURE 2.
Real time RT-PCR validation of microarray data of B. juncea roots at 4, 24, and 96 h (A,B); and of shoot at 24 and 96 h (C,D). The data of RT-PCR has been overlapped with that microarray to demonstrate expression patterns. The x-axis represents the expression of various genes in control conditions.

