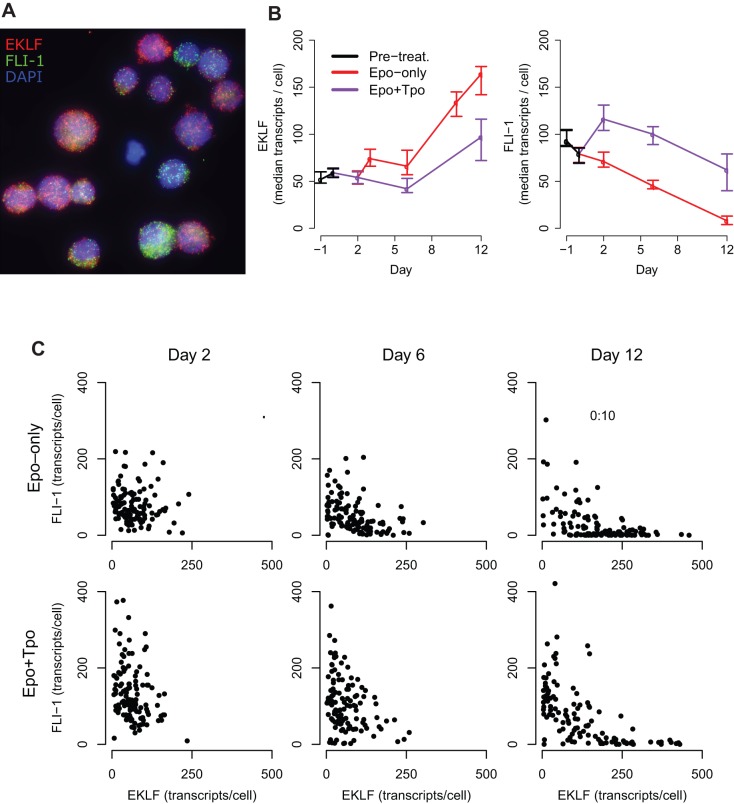
Fig. 3.
Effect of Epo and Tpo treatment on EKLF and FLI-1 levels in individual cells. UT-7/GM cells were passaged into medium containing only Epo, only Tpo, or both. On days 3 and 6, part of the Epo culture was passaged separately into medium containing both cytokines. (A) Merged microscopy image of UT-7/GM cells treated with Epo and Tpo on day 12, created by flattening 3D stacks. EKLF (red) and FLI-1 (green) transcripts are shown in cell nuclei (blue). The image was enhanced to show contrast. (B) Median EKLF and FLI-1 transcripts per cell under Epo or Epo+Tpo treatment. Day 0 refers to the day when UT-7/GM cells were passaged into medium containing only Epo, or both Epo and Tpo. Error bars denote the boot-strapped 95% confidence interval for the median. (C) Correlations between EKLF and FLI-1 levels during treatment with Epo or Epo+Tpo.

