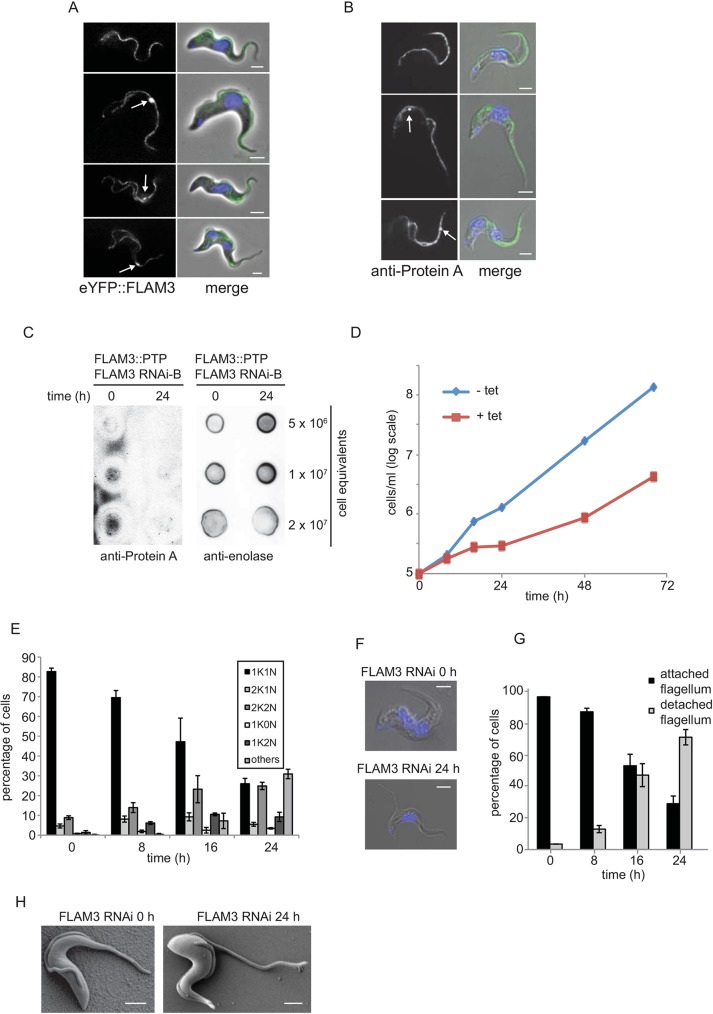
Fig. 6.
FLAM3 RNAi in BSF cells causes a reduction in the length of attached flagellum, resulting in a defect in cytokinesis. (A) BSF cells at different stages of the cell cycle expressing eYFP::FLAM3 (green); DNA was stained with DAPI (blue). White arrows indicate the strong FLAM3 signal at the distal tip of the new flagellum. Scale bars: 2 µm. (B) Immunofluorescence of BSF cells expressing FLAM3::PTP at different stages of the cell cycle. The white arrows indicate the strong FLAM3 signal at the distal tip of the new flagellum. FLAM3::PTP (green) was detected with antibody against protein A; DNA was stained with DAPI (blue). Scale bars: 2 µm. (C) Dot-blot analysis of FLAM3 RNAi cells expressing PTP::FLAM3. A series of equivalent cells was dotted onto a membrane as indicated and the PTP::FLAM3 detected with antibody against protein A. Anti-enolase was used as a loading control. (D) Cumulative growth of SM BSF FLAM3 RNAi cells with (red) or without (blue) addition of tetracycline. Data for one representative clone are shown. The increase in the growth rate of the induced cell line after 48 h is likely to be due to the presence of RNAi refractory cells accumulating in the culture. (E) Analysis of cell cycle stages following FLAM3 depletion. FLAM3 RNAi was induced with tetracycline for 24 h and the mean percentage of each cell category (±s.d.) was plotted. Per time point, ≥200 cells were scored in three independent experiments. (F) SM BSF FLAM3 RNAi cells with the before and after 24 h of FLAM3 RNAi induction; DNA was stained with DAPI (blue). Scale bars: 2 µm. (G) FLAM3 RNAi causes flagellum detachment. FLAM3 RNAi was induced with tetracycline for 24 h, and the mean percentage of cells (±s.d.) with and without flagellum detachment was plotted. Per time point, ≥200 cells were scored in three independent experiments. (H) Representative images of cells before (left panel) and after 24 h of tetracycline induction (right panel). Scale bars: 2 µm. (H) SEM images of SM BSF FLAM3 RNAi cells before and after 24 h of FLAM3 RNAi induction. The attached flagellum is shorter in induced cells. Scale bars: 2 µm.

