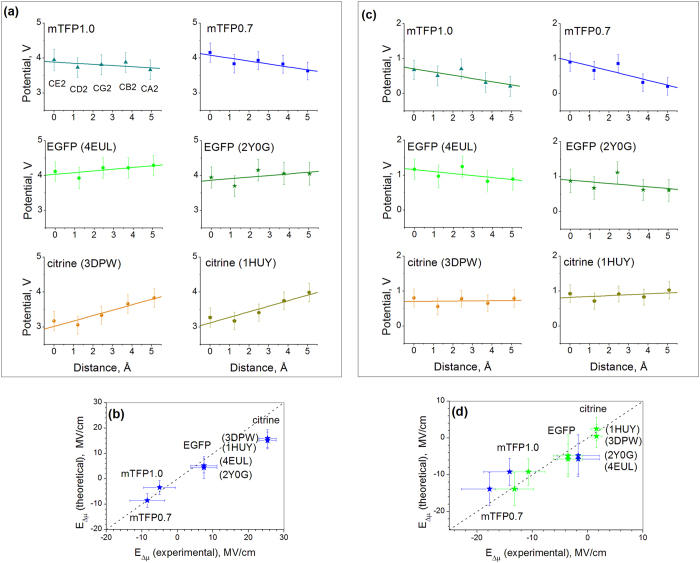
Figure 3.
(a) MD-simulated electrostatic potentials on the chromophore atoms as a function of the distance along the straight line connecting CE2 and C2 atoms (see Fig. 4 for atom notations) for six selected FP structures. For EGFP and citrine, the two sets of data points correspond to two different pdb files. The linear regressions based on the potentials of the five atoms are shown by straight lines. (b) Comparison of experimentally measured electric fields with the fields obtained from the MD simulations of potentials shown in (a). Dashed line indicates exact coincidence. (c) Same as in (a) but when calculating potentials, in addition to the chromophore the contribution from five or four (in case of citrine) amino acids or water molecules in close proximity to the chromophore were also excluded. (d) Comparison of electric fields obtained from experimentally measured Δμ values using the parameters ΔμHB and Δα either obtained from experiment (blue symbols) or calculated (green symbols) with the fields obtained from the MD simulations of potentials shown in (c). Standard deviations are shown by bars in each panel.

