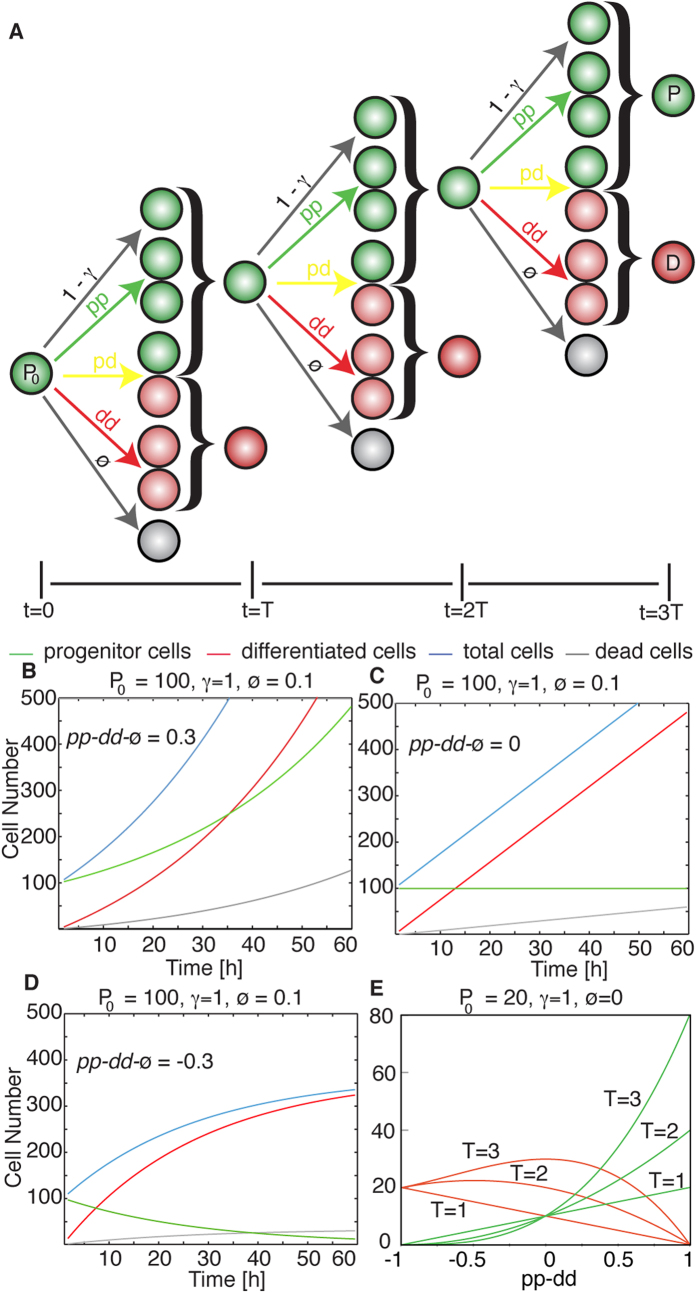
Figure 1. A Mathematical Model to Describe Stem Cell Populations.
(A) Scheme of the branching process for stem cell behavior where a initial pool of progenitors P0 undergoes three rounds of cell division facing several potential outcomes to give a final number of progenitors P and differentiated cells D. These potential outcomes correspond with the different modes of divisions with rates pp, pd or dd, apoptosis with rate Ø, or quiescence with rate (1 − γ). (B–D) Dynamics of progenitors and differentiated cells for different situations of growth (B, pp − dd − Ø > 0), homeostasis (C, pp − dd − Ø = 0) and reduction (D, pp − dd − Ø < 0) of the progenitors pool. (E) Solution of the model equations depending on the value of pp − dd for three time points. Dependence on Ø and γ can be found as Supplementary Fig. S1.

