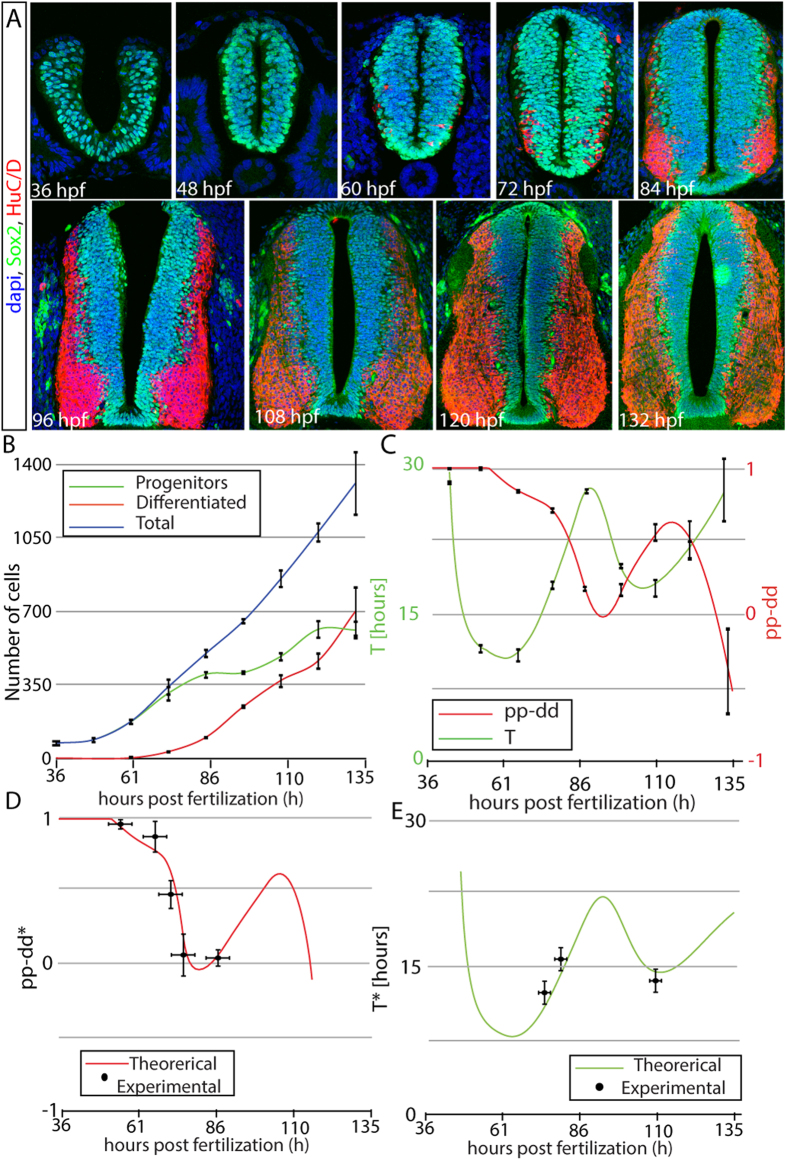
Figure 2. Dynamics of developing spinal cord shows two waves of proliferation.
(A) Confocal snapshots of developing spinal cord sections at different HPF showing staining for progenitors (green) and differentiated (red) cells. (B) Quantification of the number of progenitor and differentiated cells overtime in one hemisection of the developing spinal cord (both left and right sides of developing spinal cord are symmetric in terms of cell numbers). Lines correspond to cubic interpolation between experimental points as a guide to the eye. Measurements were performed in at least 10 spinal cord sections from at least 3 different embryos for each time point. Error bars correspond to the standard error of the mean value for multiple independent repeats of the experiment. (C) pp − dd (red) and T (green) values extracted from the model equations suggesting correlation between cell cycle length and rate of neurogenesis. (D) Comparison of experimental data (dots) and theoretical (line) predictions for the rate of differentiation pp − dd* after time correction (see Materials and Methods and Supplementary Fig. S2-a). (E) Comparison of experimental data (dots) and theoretical (line) predictions for the cell cycle T* corrected to take into account cells leaving the section (see Materials and Methods and Supplementary Fig. S2-b). Error bars in (E–D) correspond to the standard error of the mean. Experimental data obtained from3,26,27.

