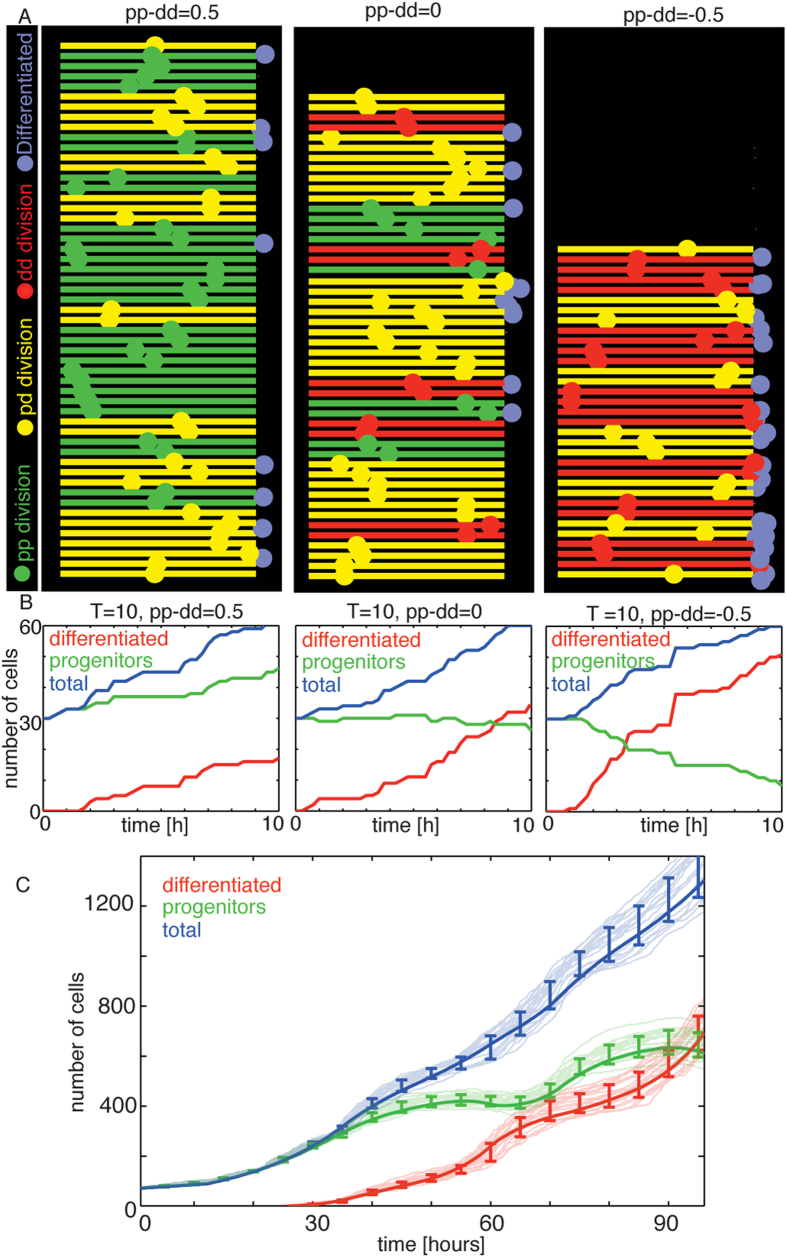
Figure 4. Phenomenological simulation of developing spinal cord growth reproduces the dynamics of the experimental system.
(A) Snapshots of three simulations with constant values for the rates of division and cell cycle length, after an initial value P0 = 30, D0 = 0 showing growth (pp − dd > 0), maintenance (pp − dd = 0) and decrease (pp − dd < 0) of the progenitor population, respectively. (B) Dynamics of the two cell populations overtime in the three different regimes explored in (A). (C) Dynamics of the two populations using the values of the cell cycle length and mode of division predicted by the theoretical model. Semi-transparent lines correspond to different runs of the model. Error-bars correspond to the standard deviation of the mean over 20 different simulations. Solid lines correspond to the experimental data. Initiation of the simulation (0 hours) correspond to 36 HPF in the experiment.

