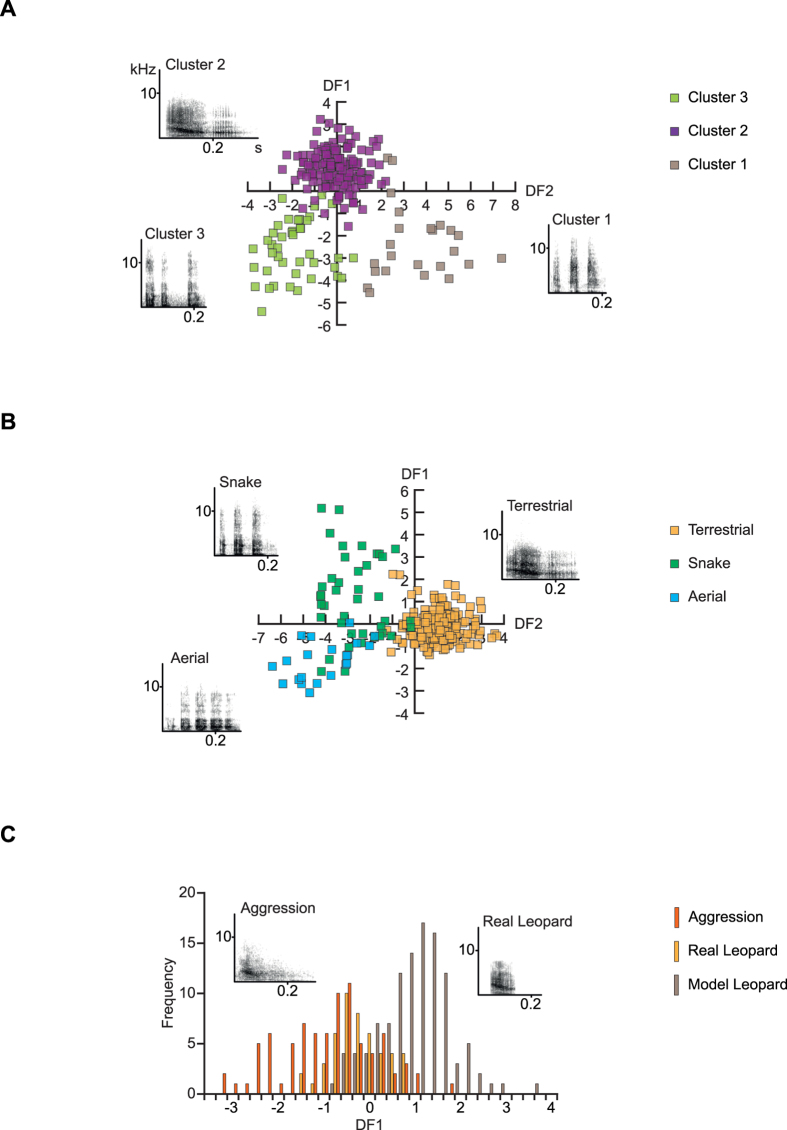
Figure 2. Structure and discriminability of male vervet vocalizations given in alarm and aggressive contexts.
(A) Scatter plot of the three identified clusters based on discriminant function analyses using cluster membership as grouping variable. Spectrograms depict representative call exemplars from East African males with a small Euclidean distance to the cluster centre for each cluster. (B) Scatter plot of the discriminant scores with corresponding spectrograms of East African male alarm calls given in response to leopards, eagles, and snakes. (C) Frequency distribution of the discriminant scores with corresponding spectrograms of South African male vocalizations given in response to leopards and during within- and between-group aggression. Abbreviations as in Fig. 1.

