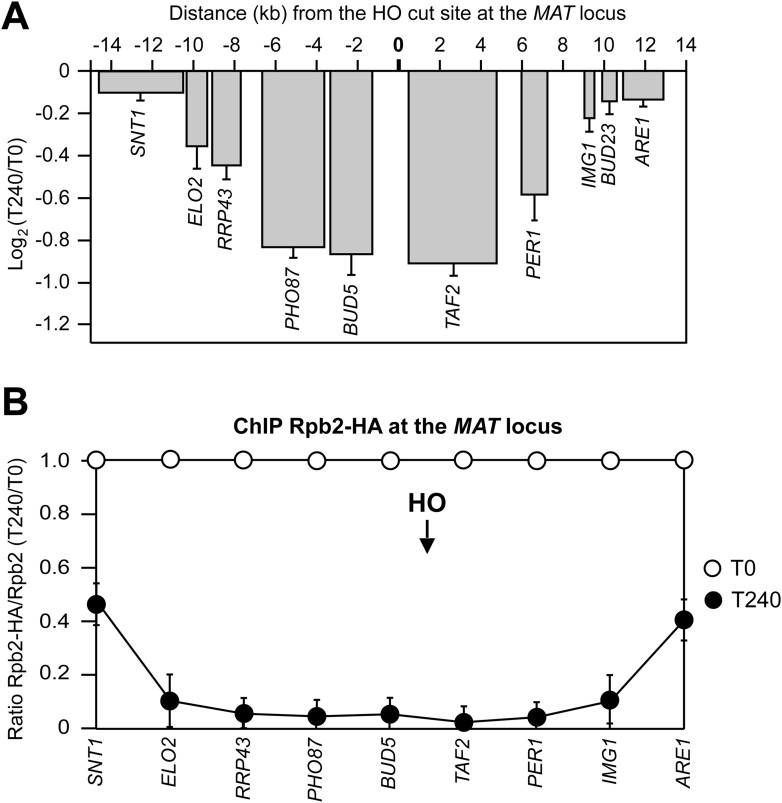
Figure 2. DSB-induced transcriptional inhibition at the MAT locus.
(A) YEPR exponentially growing cell cultures of the JKM139 strain, carrying the HO cut site at the MAT locus, were transferred to YEPRG at T0 to induce HO. RNA levels of genes located at different distances from the HO cut site were evaluated by quantitative reverse transcriptase PCR (qRT-PCR) at T0 and T240 after HO induction. Results are presented as ratios between T240 and T0. RNA levels were quantified using ∆∆Ct method and quantities were normalized to ACT1 RNA levels. The mean values ±s.d. are represented (n = 3). (B) Exponentially growing YEPR cell cultures of the JKM139 derivative strains expressing either a fully functional Rpb2-HA fusion protein or untagged Rpb2 were transferred to YEPRG at T0 to induce HO. Binding of Rpb2-HA at different distance from the DSB at T0 and T240 after HO induction was evaluated by ChIP and qPCR. Primers used were the same as in (A). Results are presented as ratios between Rpb2-HA and untagged Rpb2, both of which normalized against the corresponding input, at T240 relative to T0. The mean values ±s.d. are represented (n = 3). Rpb2-HA binding at the ACT1 gene was used as internal control.

