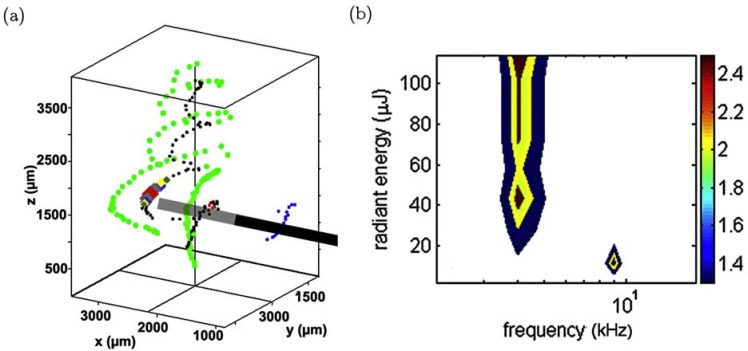
Fig. (1).
(a) 3D reconstruction of a guinea pig cochlea during stimulation. Black cylinder shows the position of the optical fibre, black dots indicates the spiral ganglion neurons, green dots are the inner pillar feet. (See online for colour) (b) The spatial tuning curve obtained from recordings of the ICC, showing stimulation at 10.8 kHz and 16.1 kHz. Fig. reproduced from [84], with permission from Elsevier.

