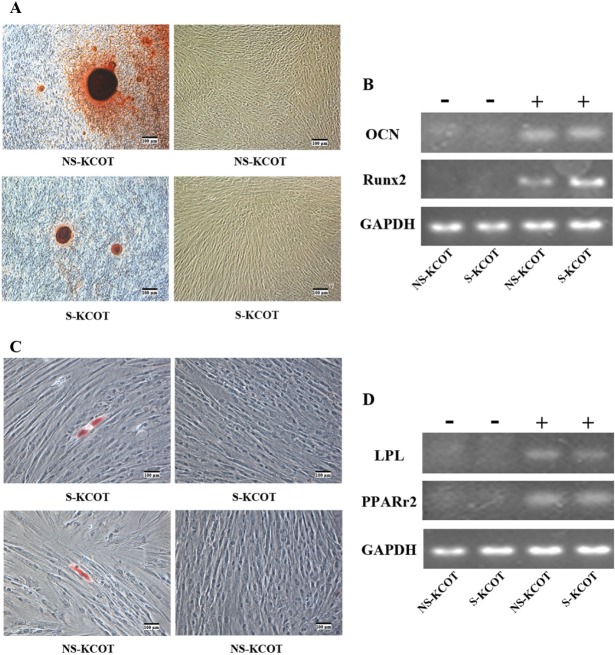
Figure 2.
Multilineage differentiation potential of S- and NS-KCOT fibroblasts. (A) S- and NS-KCOT fibroblasts cultured under osteogenic differentiation conditions were stained with alizarin red (left) after 3 wks. Cells in normal culture medium (right) were not stained. Cells are shown under differential interference contrast (DIC) optics. (B) The mRNA expression of OCN and Runx2 normalized to glyceraldehyde-3-phosphate dehydrogenase (GAPDH) expression levels was examined by reverse-transcriptase polymerase chain-reaction (RT-PCR) before (–) and on day 14 after (+) osteogenic induction. (C) S- and NS-KCOT fibroblasts cultured under adipogenic differentiation conditions were stained with Oil O Red after 3 wks. Cells grown in normal culture medium (right) served as a negative control. Images were taken under DIC optics. (D) The RNA expression of lipoprotein lipase and peroxisome proliferator-activated receptor-γ normalized to glyceraldehyde-3-phosphate dehydrogenase (GAPDH) expression level was examined by RT-PCR before (–) and 3 wks after (+) adipogenic induction.

