Figure 3.
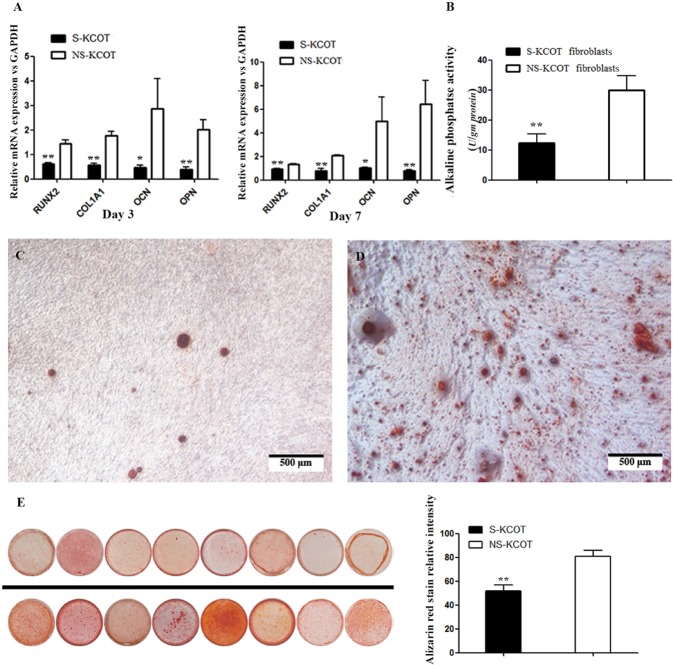
Differential osteogenic differentiation potential of S- and NS-KCOT fibroblasts. (A) The mRNA expression of genes involved in osteogenesis normalized to glyceraldehyde-3-phosphate dehydrogenase (GAPDH) expression level was examined by real-time fluorescent quantitative PCR on days 3 and 7 after induction (n = 6). (B) Alkaline phosphatase activity was detected on day 7 after induction (n = 6). (C, D) NS-KCOT fibroblasts (left) had stronger and more extensive alizarin red staining of calcium nodules than did S-KCOT fibroblasts (right). (E) Osteogenic differentiation after 3 wks by fibroblasts derived from 8 S- (top) and NS-KCOT (bottom) patient samples. Quantification of alizarin red staining was measured with Image J (n = 8). *p < .05; **p < .01.

