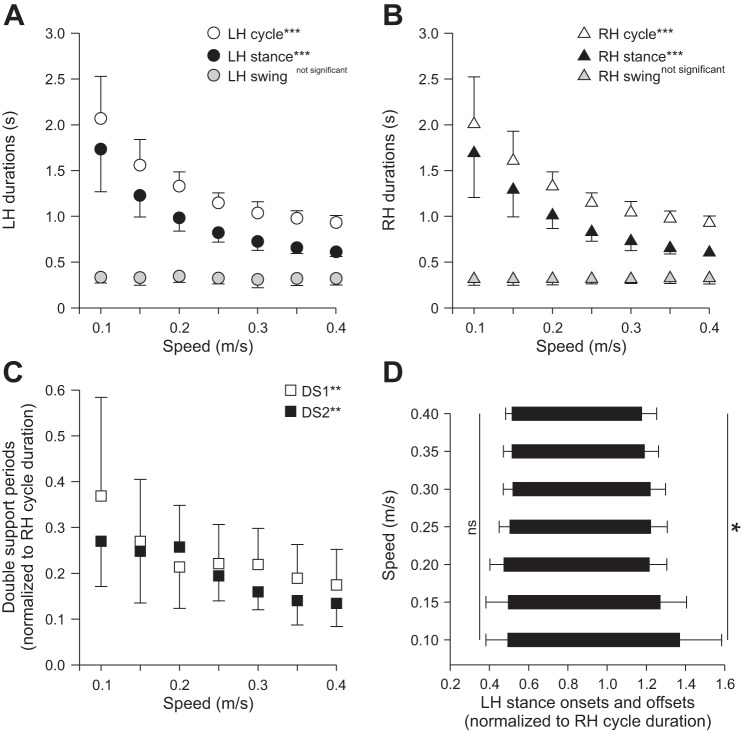
Fig. 3.
Temporal parameters during hindlimb locomotion across speeds for the group. Cycle and phase durations are shown for LH (A) and RH (B). C: DS1 and DS2 across speeds. D: stance onset and offset of LH normalized to RH cycle duration. At each speed, 10–15 cycles were averaged for each cat. Individual cat averages were then averaged for the group (n = 6). Each data point or bar indicates mean ± SD. *P < 0.05; **P < 0.01; ***P < 0.001 indicate significant effect of speed (repeated-measures ANOVA); ns, not significant.

