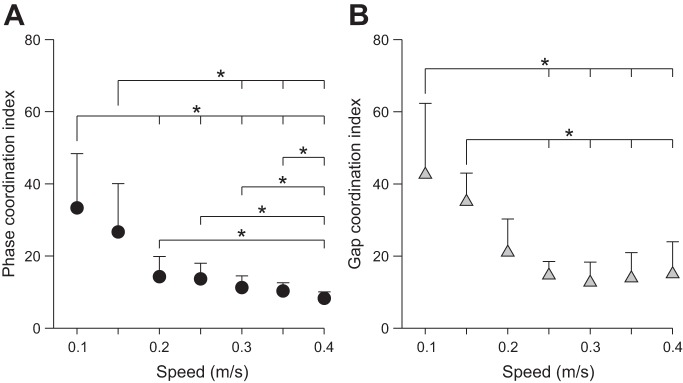
Fig. 8.

Step-to-step temporal and spatial phasing across speeds for the group. For each cat, the phase (A) and gap coordination indexes (B) were measured and then averaged for the group (n = 6) at each speed. Each data point indicates mean ± SD. *P < 0.05 indicates a significant difference between speeds (pairwise comparisons).
