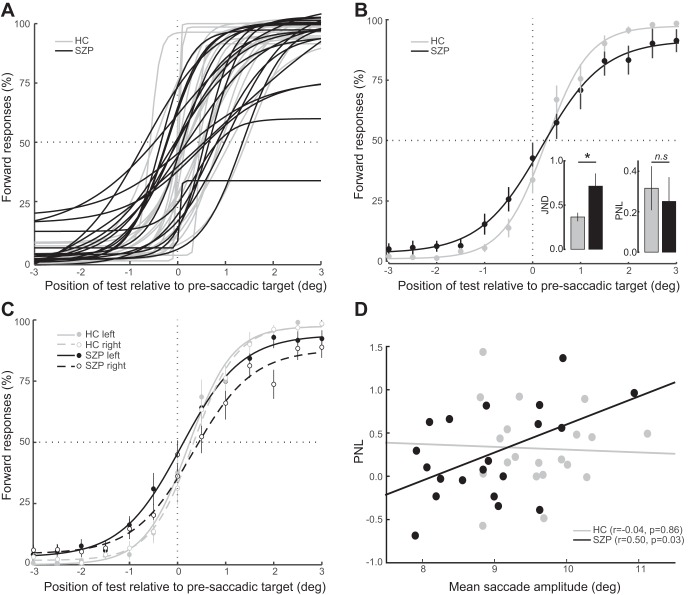
Fig. 2.
A: individual fits of the mean percentage of forward responses as a function of target displacement. On the x-axis, negative and positive values indicate postsaccadic targets that are presented toward or away from the fixation point, respectively, relative to the presaccadic target location. B: functions shown were fitted to group-averaged responses for visualization purposes only and thus differ from the analyses of individual observers' data described in results. Insets show median JND and mean PNL values from the individually fitted psychometric functions. C: mean percentage of forward responses as a function of target displacement fitted to group-averaged responses, separated by saccadic directions. D: relationship between PNL and mean saccade amplitude. Each circle corresponds to one participant.

