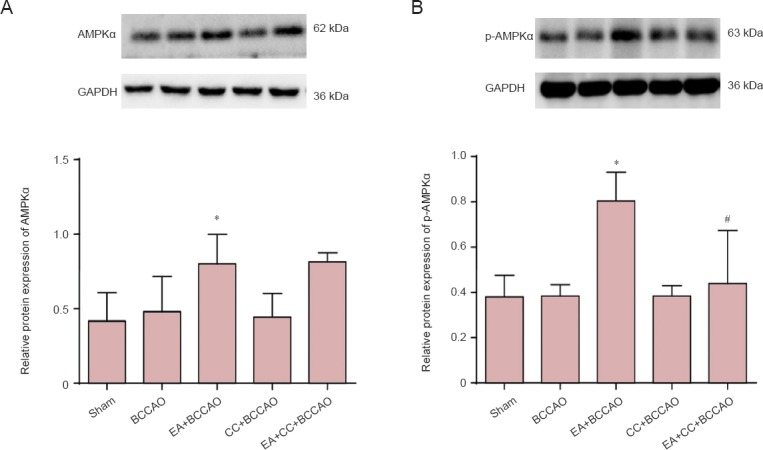
Figure 3.

Western blot analysis of protein expression of AMPKα (A) and p-AMPKα (B) in the hippocampal CA1 region at 72 hours after BCCAO.
Data are presented as the mean ± SD (n = 6 mice in each group), and were analyzed by one-way analysis of variance followed by post hoc Student-Newman-Keuls test. Values represent the optical density ratio of target protein to GAPDH. Experiments were performed in triplicate. *P < 0.05, vs. BCCAO group; #P < 0.05, vs. EA + BCCAO group. AMPKα: Adenosine monophosphate-activated protein kinase α; p-AMPKα: phosphorylated adenosine monophosphate-activated protein kinase α; EA: electroacupuncture; BCCAO: bilateral common carotid artery occlusion; CC: compound C (an adenosine monophosphate-activated protein kinase antagonist).
