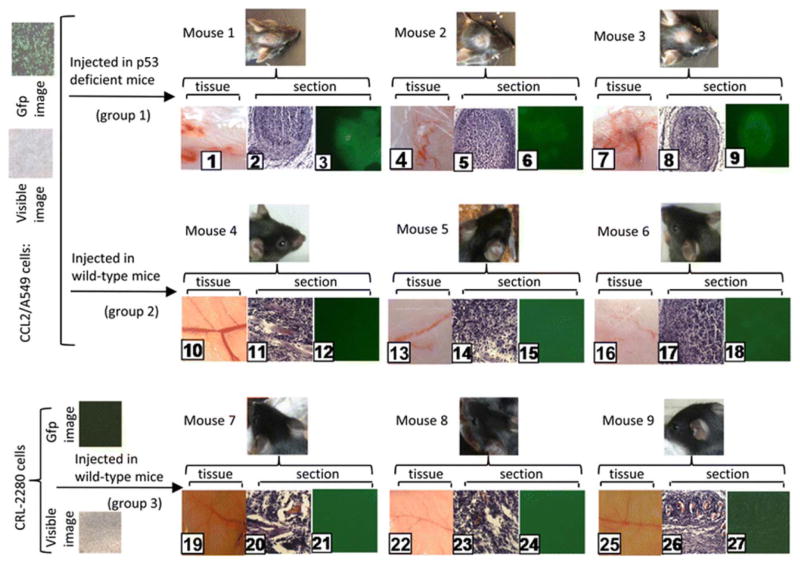
Fig. 6.
Image analysis of xenograft mouse model. p53-deficient mice (No. 1–18, groups 1 and 2) were treated with CCL2/A549 cells or wild-type mice (No. 10–27, group 3) were treated with CRL-2280 cells as control. Treated mice were monitored daily for health care and maintained for 3 weeks. Tissues and sections from treated mice (No. 1–27, groups 1–3) were observed and photographed in visible light for structure identification of tissues (No. 1, 4, 7, 10, 13, 16, 19, 22, or 25) or sections (No. 2, 5, 8, 11, 14, 17, 20, 23, or 26). Fluorescent light was used for signal location of sections (No. 3, 6, 9, 12, 15, 18, 21, 24, or 27) using an Olympus BX40 microscope at ×200 magnification. Image analysis was performed with Image-Pro plus 5.0. The paired panels of tissues and sections (No. 1–3, 4–6, 7–9, 10–12, 13–15, 16–18, 19–21, 22–24, or 25–27) were obtained from each mouse. The phase contrast panels (No. 2 and 3, 5 and 6, 8 and 9, 11 and 12, 14 and 15, 17 and 18, 20 and 21, 23 and 24, 26 and 27) are pairs of sections from each mouse

