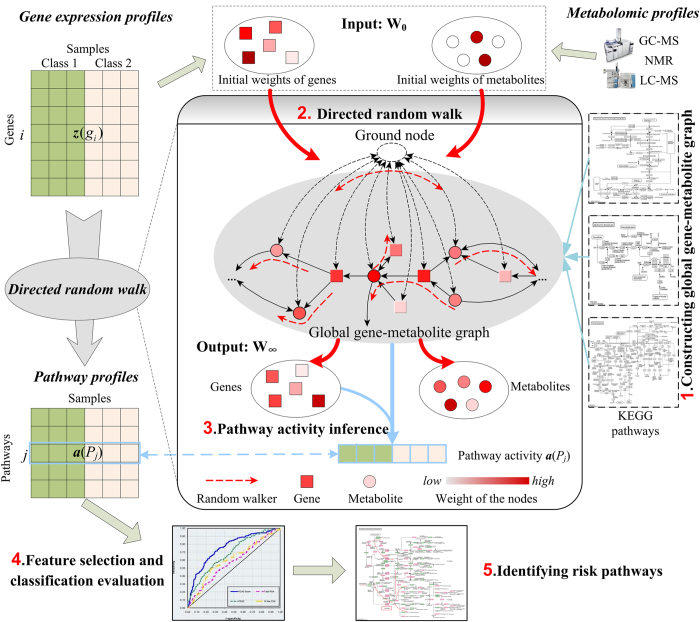
Figure 1. Schematic overview of DRW-GM.
The gene expression profiles are translated into pathway profiles (rows represent pathways and columns represent samples) by DRW-based pathway activity inference. The global gene–metabolite graph is constructed on KEGG metabolite pathways. The input W0 of DRW is the initial weights of genes and metabolites, which are obtained from gene expression profiles and metabolomic profiles respectively. The output W∞ is the probability weight vector of nodes when DRW reaches a steady state. W∞ measures the topological importance of genes by incorporating both gene and metabolite information. The pathway activity is a expression value vector synthetized by topologically weighted differential gene expression vectors in the pathway (Formula (2)).

