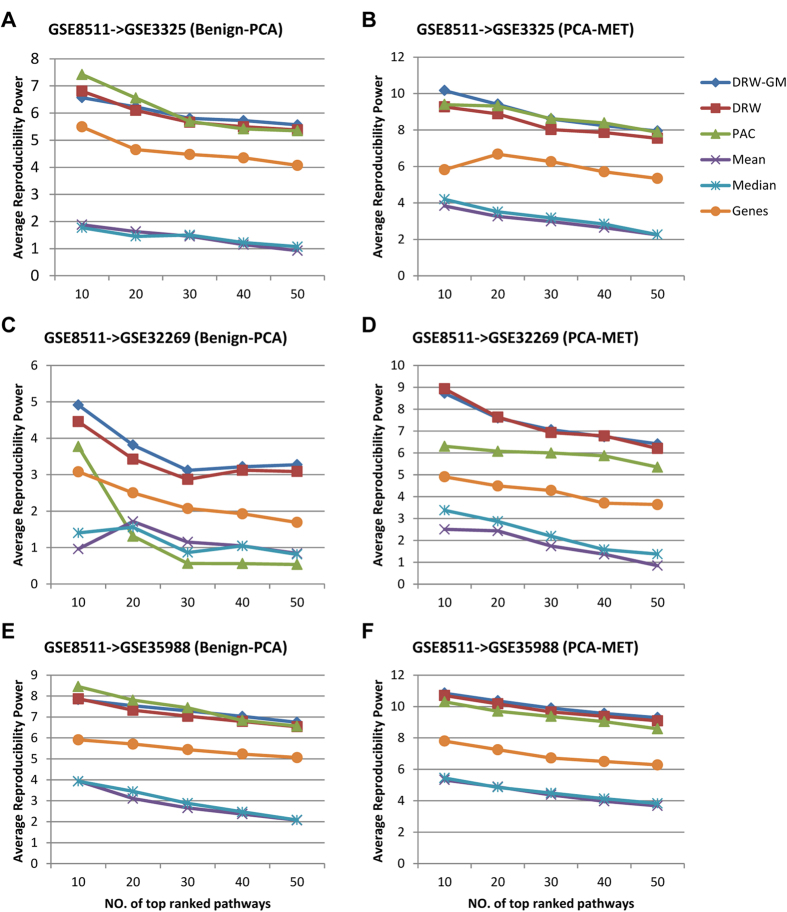
Figure 4. Reproducibility power of pathway activities.
The reproducibility powers of pathway activities inferred by DRW-GM, DRW, PAC, Mean and Median were compared. The individual gene markers were also incorporated for comparison. (A,C,E) Comparison of reproducibility powers for Benign vs PCA (GSE8511->GSE3325, GSE8511->GSE32269, and GSE8511->GSE35988). The x-axis corresponds to the number N of top ranked pathways that considered, and the y-axis shows the reproducibility power Cscore of the top N pathways. N = 10, 20, 30, 40, 50. (B,D,F) Comparison of reproducibility powers for PCA vs MET.

