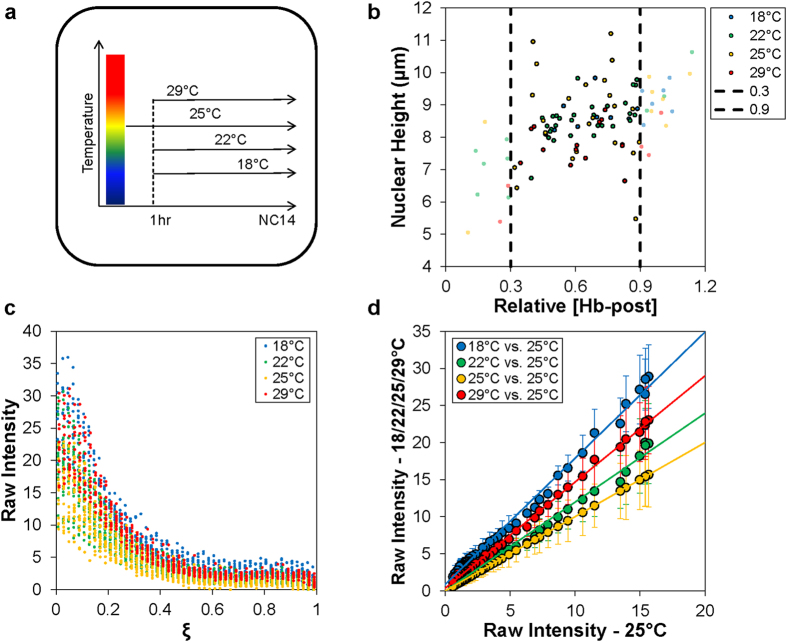
Figure 1. Experimental design and Bcd intensity measurements.
(a) Shown is a graphical representation of the temperature maturation scheme used to generate the embryos for subsequent experiments. (b) Shown is a plot of the nuclear height measurements over the respective posterior hb expression level (relative to the anterior level) of individual embryos selected for further quantitative analysis. (c) Shown are raw fluorescent intensities detecting Bcd in individual embryos plotted as a function of fractional embryo length (ξ). For presentation purposes, data for different thermal cohorts are shown with 0.002 offsets on ξ axis to enhance visual clarity. (d) Shown are scatter plots of the mean raw Bcd intensity values from embryos maturing at 18 °C, 22 °C, 25 °C and 29 °C plotted against the intensities from embryos maturing at 25 °C. A linear fit is shown for each pairwise plot; error bars are standard deviation (s.d.).

