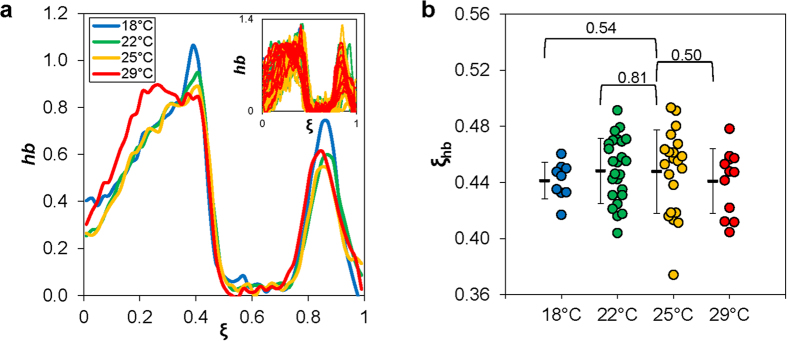
Figure 3. Evaluating the hb expression boundary in embryos maturing at different temperatures.

(a) Shown are the mean hb expression profiles along the AP position ξ in embryos maturing at different temperatures (18 °C: blue, 22 °C: green, 25 °C: yellow, 29 °C: red). Inset shows data from individual embryos. The hb FISH intensity data shown here are background subtracted using a non-expressing region and subsequently normalized to peak levels (see Methods). (b) Shown are the measured hb expression boundary positions of individual embryos, with the mean and s.d. for the each thermal cohort shown. Also shown are p-values from Student’s t tests for comparisons with 25 °C.
