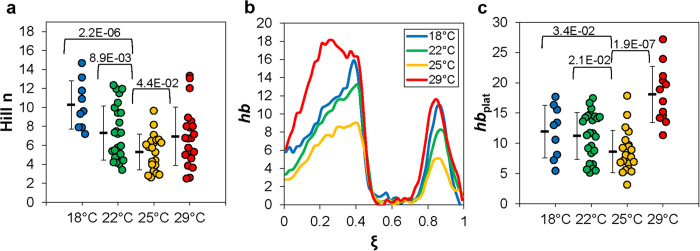
Figure 6. Temperature effects on calculated Hill n values and hb expression levels.

(a) Shown is a swarm plot of the estimated individual Hill n values for individual embryos of the indicated thermal cohorts. These values are derived from linear fits shown in Fig. 5. (b) Shown are the mean, un-normalized hb expression profiles in embryos maturing at the indicated temperatures. (c) Shown are un-normalized levels of hb expression at the plateau region of individual embryos, with the mean and s.d. for each cohort shown. For panels a and c, p-values from Student’s t tests for comparisons with 25 °C are also shown.
