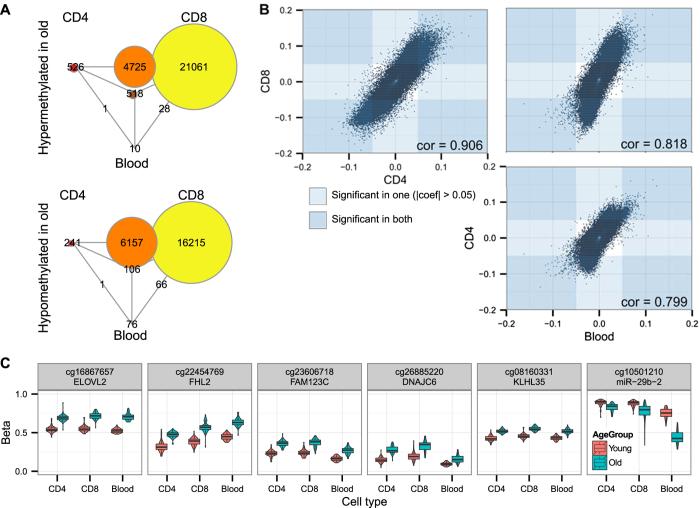
Figure 1. Differentially methylated sites in PBL, CD4+ and CD8+ T cells.
(A) Venn diagram showing the overlaps between age-related differentially methylated sites in PBL, CD4+ and CD8+ T cells. The circles in the corners show the number of CpG sites unique to each cell type and the intermediate circles show the number of overlapping sites between the respective cell types. (B) Correlation of fold changes for all sites. The regions of the plot that correspond to |fold change| > 0.05 are indicated by blue rectangles (t-test adjusted p-value < 0.01). (C) Methylation levels of the top differentially methylated CpG sites in CD4+ and CD8+ T cells and in PBL samples.

