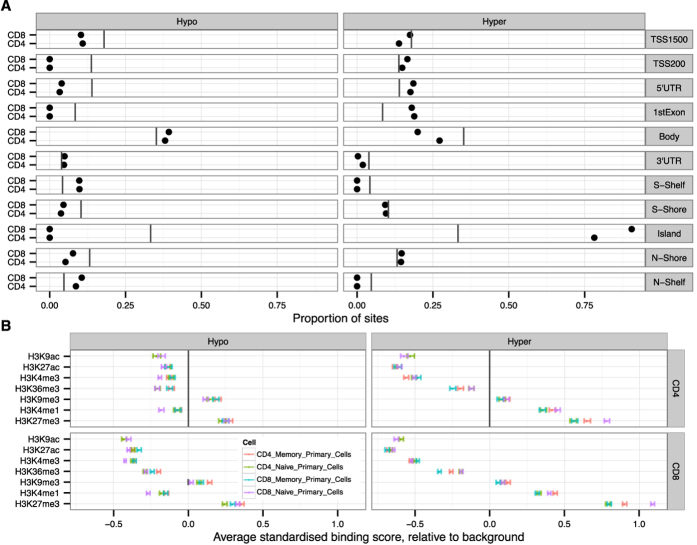
Figure 3. Location of differentially methylated sites in relation to gene subregions and histone modifications.
(A) The proportions of differentially hypo- and hypermethylated sites that are related to various gene and CpG island subregions are marked with black dots. The vertical lines show the proportion of all CpG sites of HumanMethylation 450 K array located within each subregion. (B) The epigenetic landscape near the differentially methylated sites using Roadmap Epigenomics histone modification data from naïve and memory CD4+ and CD8+ cells. The figure shows the average difference in standardized binding score between differentially methylated and background of non-differentially methylated sites. The influence of gene and island subregion distribution for the sites (shown in Panel A) was subtracted before the analysis.

