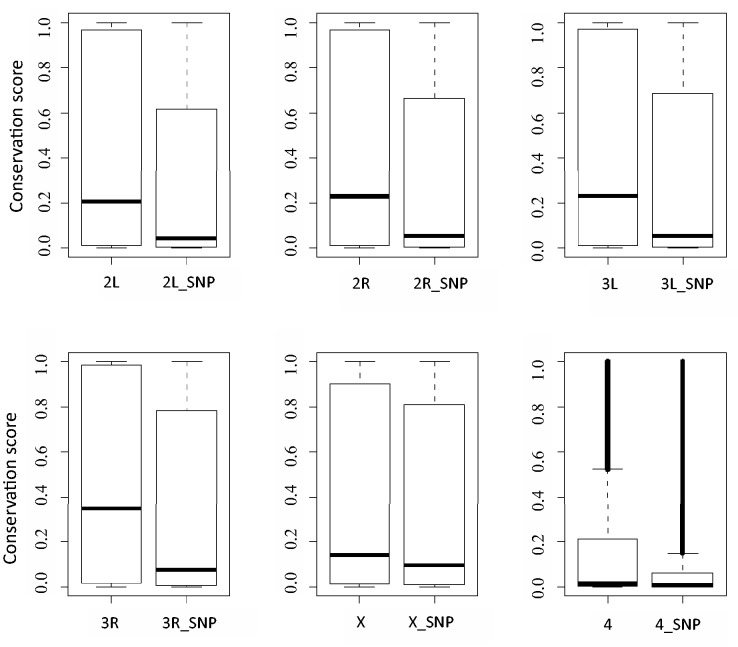
Figure 1.
Comparison of evolutionary conservation scores between a whole chromosome and its polymorphism sites. In each plot, the left boxplot depicts conservation scores of a whole chromosome, such as ‘2L’ for chromosome 2L; the right boxplot displays conservation scores of which polymorphisms exists, for example ‘2L_SNP’ representing polymorphism sites of chromosome 2L.

