Figure 4.

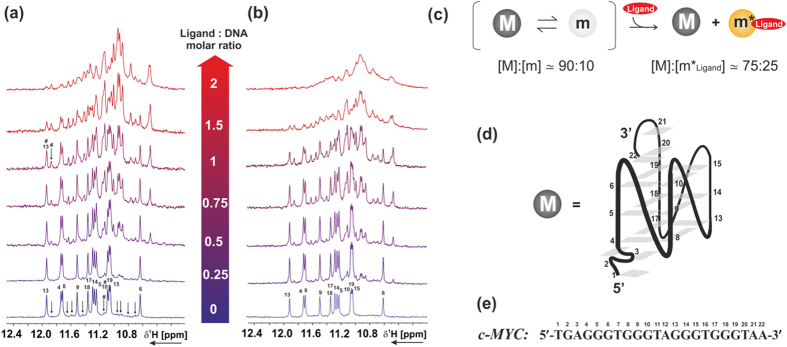
Imino region of 100 μM c-MYC in the presence of BTC f at different [ligand]:[DNA] molar ratio, (a) in 25 mM Tris·HCl buffer at pH 7.4 containing 100 mM KCl, 90% H2O/10% D2O (b) in 25 mM Tris·HCl buffer at pH 7.4 without additional KCl, 90% H2O/10% D2O. Titrations were performed at 298 K, 600 MHz. Signals from the major conformation of c-MYC are labeled according to the numbering shown in panel (e), while signals from the binding-competent minor conformation are marked with arrows. (c) Scheme of the proposed binding mechanism with estimated population of each state. Major conformation, minor conformation in the free-form and minor conformation in the ligand-bound form are indicated with M, m and m*Ligand, respectively. Population of the states in the absence of the ligand was estimated from the ratio of the integrals of signals marked in the spectrum with #, while population of the states in presence of ligand was estimated at a [ligand]:[DNA] molar ratio of 1, from the ratio of the integrals of signals marked in the spectrum with #. (d) Folding of the major conformation (M) of c-MYC determined by Ambrus et al.[PDB code: 1XAV]13. (e) c-MYC sequence used for NMR binding titration.
