
FIGURE 2.
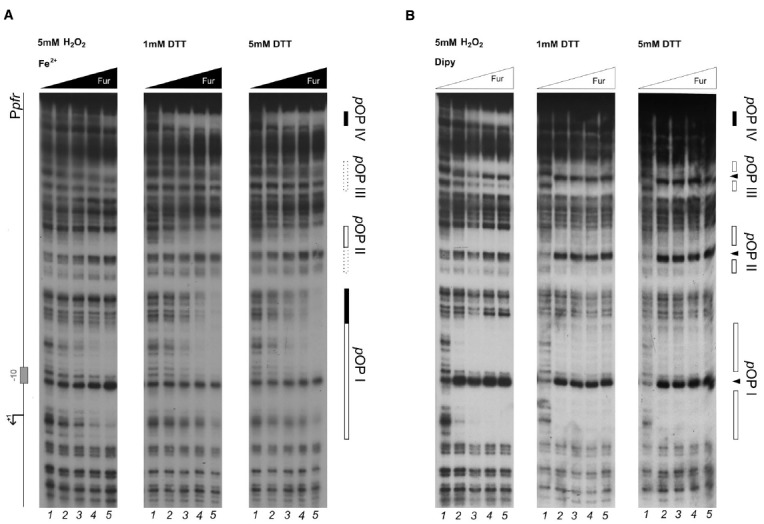
DNase I protection patterns of Fur on the pfr promoter in reducing and oxidative conditions. DNase I footprinting assay of Fur protein on the Ppfr probe in presence of 150 μM of (NH4)2Fe(SO4)2 (A) or 150 μM Dipyridyl (B). A schematic representation of the promoter region is reported on the left side of the panel. Regions corresponding to Fur operator elements are indicated by boxes: black, holo-Fur operators; white, apo-Fur operators. Arrowheads indicate hypersensitivity bands to DNase I treatment. Black and white triangles indicate increasing concentrations of Fur protein, in the presence of iron and iron chelator, respectively. The redox condition of the assay is indicated on the top of the footprinting experiment: 5 mM H2O2 (oxidative), 1 mM DTT (mildly reducing), 5 mM DTT (reducing). Lane numbers 1 to 5: 0, 29, 58, 116, and 232 nM Fur dimer.