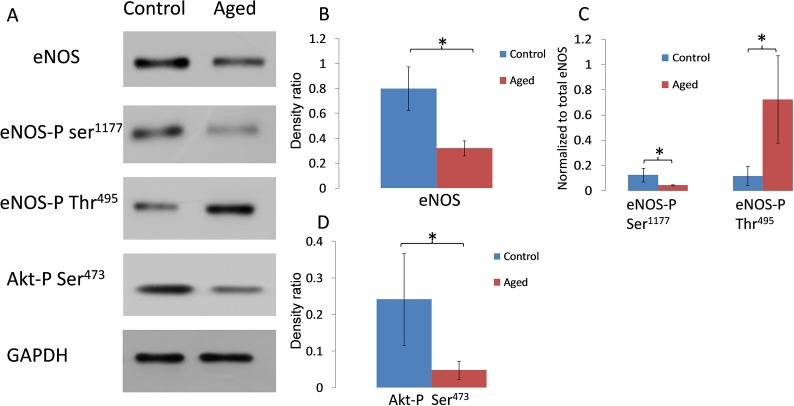
Figure 1.
Western blot analysis of eNOS, eNOS-phospho Ser1177, eNOS-phospho Thr495, and Akt-phospho levels in cultured AAP cells. (A) Representative Western blots showing a comparison of protein/phosphorylation levels in AAP cell monolayers cultured under normal or hyperoxic conditions for 2 weeks (aged). (B–D) Densitometric analyses of Western blots for eNOS-phospho Ser1177 (normalized to total eNOS), eNOS-phospho Thr495 (normalized to total eNOS), or Akt-phospho (normalized to glyceraldehyde 3-phosphate dehydrogenase) from control and aged cells. *P < 0.05; n = 6. Error bar denotes SD.

