
Figure 4.
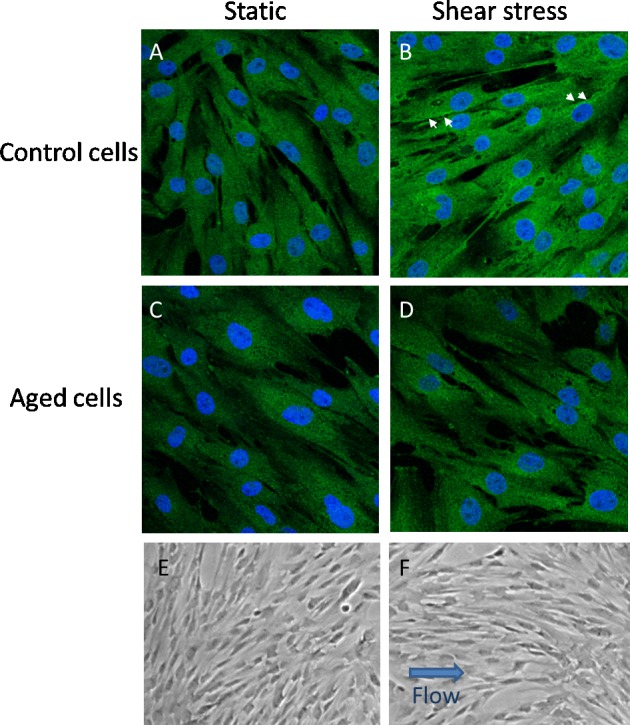
Effects of shear stress on AAP cell alignment plus eNOS expression and localization. (A–D) Immunofluorescence images taken of cells (control [A, B] versus aged [C, D]) subjected to static culture or shear stress (8 dynes/cm2 for 24 hours) and then labeled with antibodies specific for eNOS. Arrows point to labeling at cell boundaries in control cells; however, this is not apparent in aged cells. Phase-contrast images of AAP cells (control versus aged) were exposed to 2 days of 5 dynes/cm2 shear stress or remained in static culture (E, F). An arrow indicates the direction of flow in cells subjected to shear stress. Shown are representative results from one experiment using one cell line of four in total.