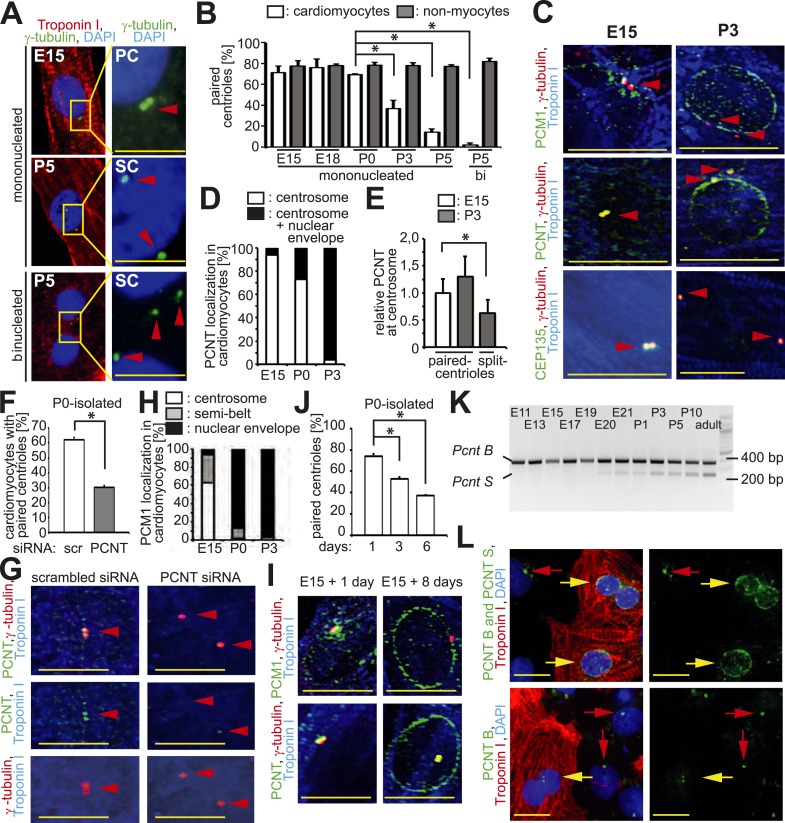
Figure 1. Loss of centrosome integrity during heart development.
(A) Analysis of centriole (γ-tubulin) configuration in E15- or P5-isolated ventricular rat cardiomyocytes (Troponin I). Nuclei: DAPI. PC: paired-centrioles. SC: split-centrioles. Scale bar: 5 µm. (B) Frequency of cells with paired-centrioles during development. Bi: Binucleated. (C) Analysis of the localization of the centrosome proteins PCM1, PCNT (Pericentrin), and CEP135 in isolated cardiomyocytes. (D) PCNT localization frequency in cardiomyocytes isolated from different developmental stages. (E) Centrosomal PCNT signal intensity in P3-isolated cardiomyocytes with paired- and split-centrioles relative to E15-isolated cardiomyocytes. (F) Frequency of paired-centrioles in P0-isolated cardiomyocytes after siRNA-mediated Pcnt knockdown. scr: scrambled. (G) Representative images of the analysis in (F). (H) PCM1 localization frequency in cardiomyocytes isolated from different developmental stages. (I) Analysis of PCM1 and PCNT localization in E15-isolated cardiomyocytes cultured for either 1 or 8 days. (J) Frequency of P0-isolated cardiomyocytes with paired-centrioles after 1 day, 3 days, or 6 days in culture. (K) RT-PCR analysis of Pcnt B and S isoform expression during rat heart development in vivo. (L) Localization of PCNT isoforms. P3-isolated cardiomyocytes immunostained with antibodies against either both PCNT B and S isoforms or only the PCNT B isoform. Yellow arrows: cardiomyocyte nuclei. Red arrows: non-myocyte nuclei. Unless otherwise noted, scale bars: 10 µm; red arrowheads: centrioles; data are mean ± SD, n = 3, *: p < 0.05. For the experiments ≥ 10 cells (E), ≥ 50 cells (B, F, J), ≥ 100 (D, H) cells were analyzed per experimental condition.


