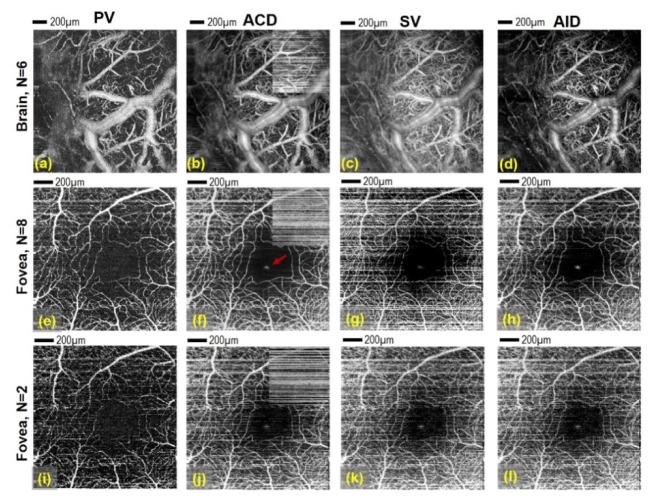
Fig. 3.
Presentation of angio-OCT maps obtained from two data sets (I – mouse brain (a-d) measured with protocol E and II - eye of healthy volunteer (e-l)) measured with protocol D processed in four different ways: PV – Phase variance angiograms (first column), ACD – Absolute Complex Difference angiograms (second column), SV – Speckle Variance angiograms (third column) and AID – Absolute Intensity Difference (fourth column). The last row presents the human retinal maps obtained for only two B-scans from the group of eight. Brain image size area: 2 mm x 2mm; human eye image size: 1.5 mm x 1.5 mm. Red arrow on (f) shows specular reflection artifact visible also on (g, h, j-l). Comparison between axial phase stabilization and no stabilization in ACD algorithm is visible on (b, f, j) - small insets placed in upper right corners of ACD angiograms show non-stabilized data. Scale bar: 200 µm.

