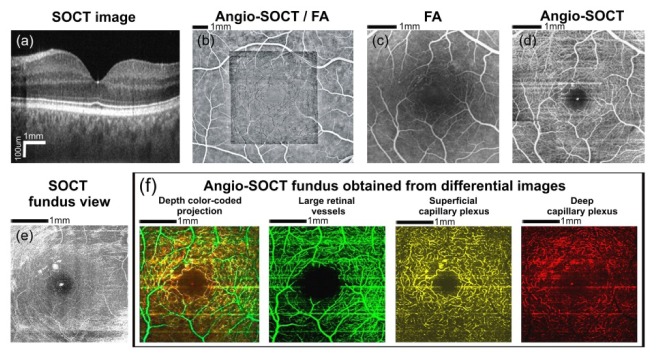
Fig. 5.

Data obtained from a 46 year-old patient with diabetic retinopathy. Visual acuity in the right eye was 20/25. (a) OCT cross-sectional image (protocol C). (b) The automatically generated OCT mosaic projected onto the fluorescein angiography image (protocol B). (c) Fluorescein angiography. (d) Angio-OCT mosaic size - 4.5 x 4.5 mm. The tiny white area in the center corresponds to the foveal specular reflex. (e) OCT fundus view (protocol A). (f) Color-coded angio-OCT fundus views showing retinal vasculature at different levels (protocol A). Large retinal vessels were coded green, the superficial capillary plexus was coded yellow and the deep capillary plexus was coded red. It should be noted that the blood vessels of the superficial capillary plexus mark the edge of the foveal avascular zone. Angio-OCT imaging region- 4 x 4 mm.
