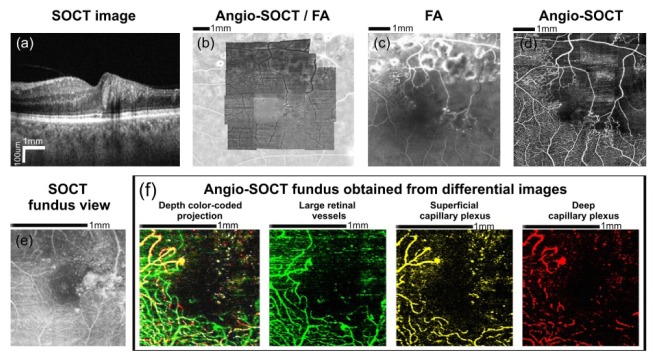
Fig. 8.

Data obtained from a 55 year-old patient with branch retinal vein occlusion. Visual acuity in the left eye was 20/100. (a) OCT cross-sectional image shows the decreased retinal thickness within the temporal macula (protocol C). (b) The automatically generated angio-OCT mosaic projected onto the fluorescein angiography image (protocol B). (c) Fluorescein angiography image (d) Angio-OCT mosaic of the fundus area shown in Fig. 8(c). An extensive non-perfusion area is clearly visible. Angio-OCT imaging region - 6 x 6 mm. (e) OCT fundus view showing changes of retinal reflectivity (protocol A). (f) Color-coded angio-OCT fundus views showing retinal vasculature at different levels (layers) within the temporal macula (protocol B). Large retinal vessels were coded green, the superficial capillary plexus was coded yellow and the deep capillary plexus was coded red. It is possible to follow the three-dimensional pattern of the retinal capillary network. Angio-OCT imaging region - 1.5 x 1.5 mm.
