Fig. 9.

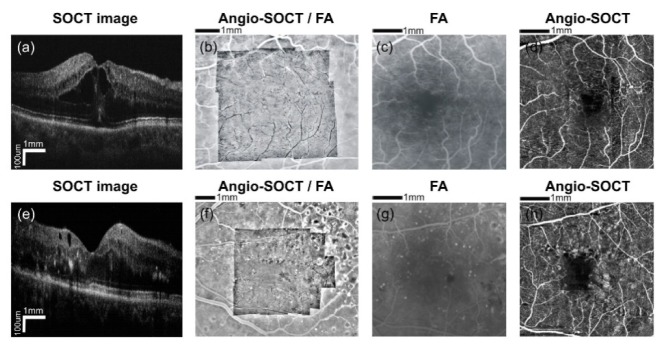
Diabetic macular edema. The images in the upper row show the 69 year-old patient. Visual acuity in the left eye was 20/63. The images in the bottom row show the 40 year-old patient. Visual acuity in the left eye was 20/80. (a) OCT cross-sectional image showing the intraretinal fluid spaces within the macula (protocol C). (b) The automatically generated angio-OCT mosaic projected onto the fluorescein angiography image (protocol B). (c) The fluorescein angiography presents the enlargement of the foveal avascular zone. Angio-OCT imaging region - 4.5 x 4.5 mm. (d) The angio-OCT mosaic shows the fundus area as seen in Fig. 9(c). The foveal avascular zone is visibly enlarged. (e) OCT cross-sectional image showing a few intraretinal fluid spaces, located in the inner retinal layers within the macula (protocol C). (f) The automatically generated angio-OCT mosaic projected onto the fluorescein angiography image (protocol B). (g) The fluorescein angiography presents the enlargement of the foveal avascular zone and the non-perfusion areas. (h) The angio-OCT mosaic shows the fundus area as seen in Fig. 8(g). The foveal avascular zone is visibly enlarged. Adjacent to the avascular zone, the non-perfusion areas are shown. Angio-OCT imaging region - 4.5 x 4.5 mm.
