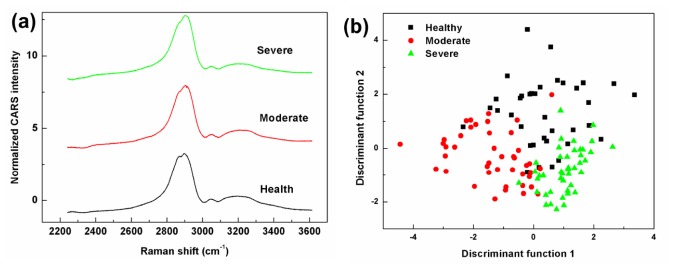
Fig. 3.

(a) Averaged preprocessed CARS spectra of healthy tissue and two PAD levels: moderate and severe. The spectra have been offset vertically for clarity. (b) A PC-DFA plot showing the first two discriminant function scores of a total of 122 CARS spectra from healthy tissue and two levels of PAD.
