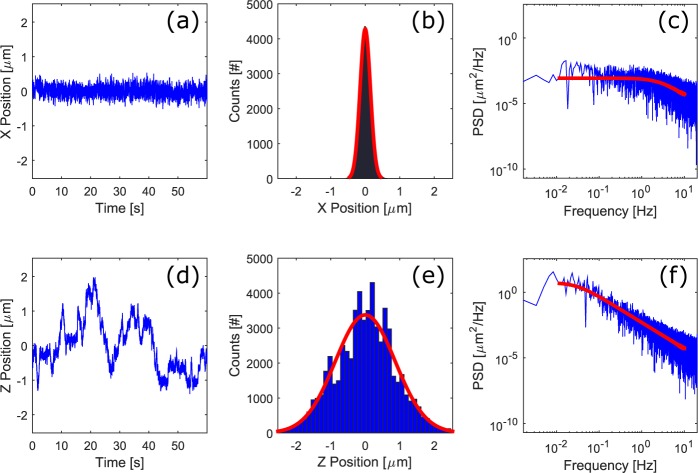
Fig. 2.
An example data set for characterization of the trap stiffness. (a,d) The first 60 seconds of the x- and z- position measurements. (b,e) Histograms of the particle position trace (blue) and the Gaussian fit (red). (c,f) Power spectra of the particle position traces (blue) and the fitted curves (red).

