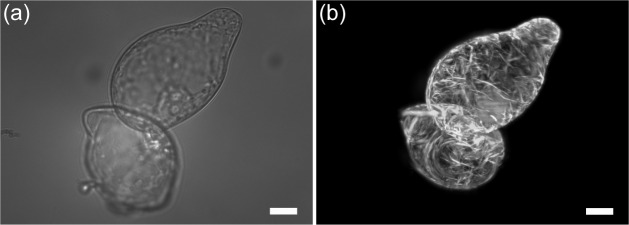
Fig. 3.

Images of optically trapped tobacco BY-2 cells expressing microtubules labeled with GFP. (a) Bright field image. (b) Maximum intensity projection of light sheet fluorescent microscope images of the same cells taken along the z-axis. Scale bar 15 μm. See Visualization 1 (14.7MB, AVI) for maximum intensity projection video with rotating view angle.
