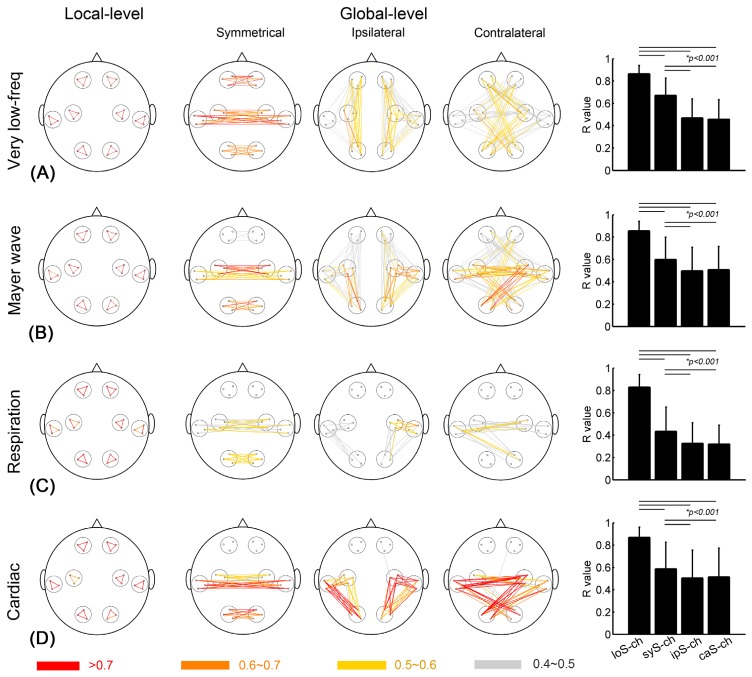
Fig. 6.
Similarities of superficial interference in four specific frequency bands based on HbR data: (A) the very low-frequency fluctuations between 0.01 and 0.05 Hz, (B) the Mayer waves between 0.07 and 0.15 Hz, (C) the respiratory waves between 0.2 and 0.4 Hz, and (D) the cardiac pulsations between 0.8 and 2 Hz. In each respective graph, the colored lines represent the S-channel pairs in different ranges of similarity values, and the error bars represent the standard deviations.

