
Fig. 8.
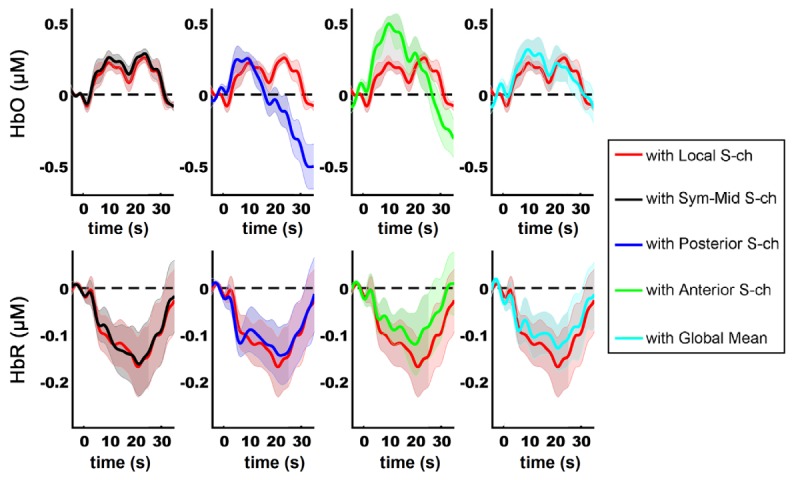
Block-averaged motor responses from the L-channels within ROI for a representative subject. In each graph, the solid curves represent the block-averaged time courses, and the shaded areas indicate the standard errors across the seven blocks. Please note that the duration of finger tapping varied from 20 to 30 seconds among the seven blocks.