
Fig. 10.
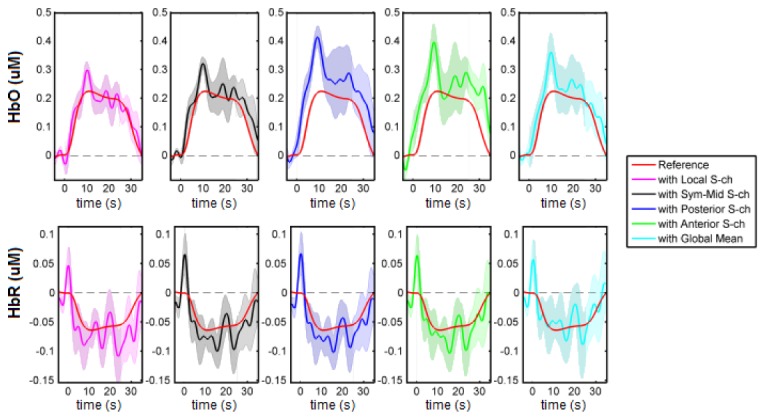
Block-averaged motor responses from the four L-channels within the ROIs for a representative subject. In each graph, the red line represents the true task-evoked brain response, the non-red line represents the recovered task-evoked brain response after line regression, and the shaded areas indicate the standard errors of the recovered brain response across the seven blocks.