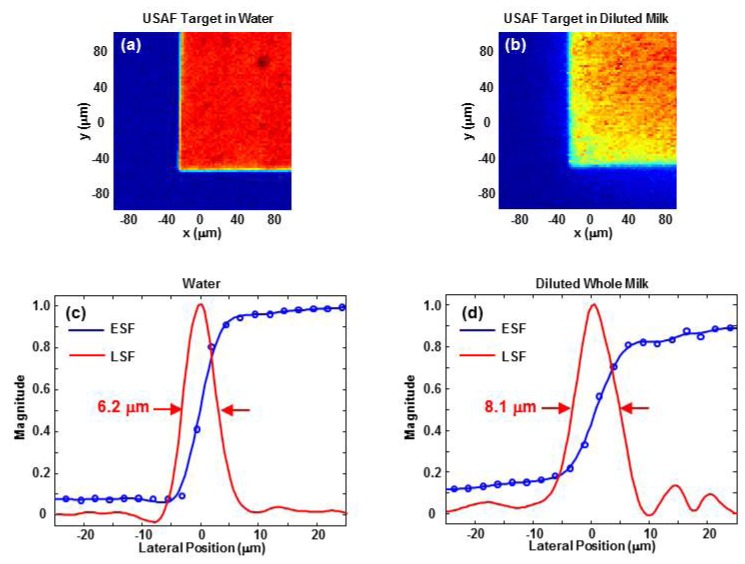
Fig. 3.
OR-PAM images of a corner of the Group 0, Element 1 pattern of a USAF target immersed in 1.1 mm of (a) water and (b) 25% whole milk. Both images cover a 200 x 200 μm region and are shown over a linear scale. The horizontal edge spread function (ESF) and line spread function (LSF) in water and diluted milk are shown in (c) and (d), respectively. Both plots are centered on the edge of the chrome pattern.

