Fig. 2.

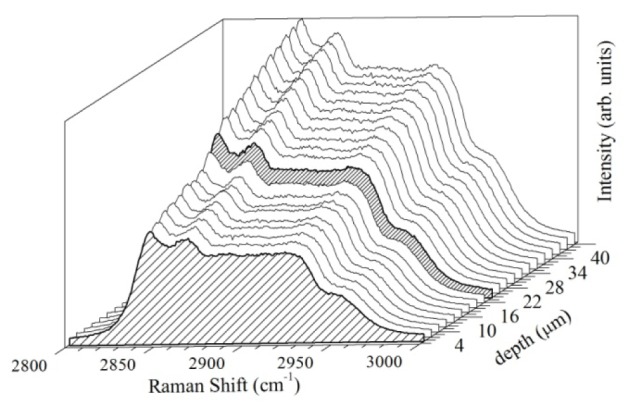
Oil-culture interface identification in the droplet. The two highlighted regions corresponding to the spectrum of the surface of the mineral oil (0 µm in the z-axis) and the interface between oil and culture medium (18 µm z-axis) are shown.

Oil-culture interface identification in the droplet. The two highlighted regions corresponding to the spectrum of the surface of the mineral oil (0 µm in the z-axis) and the interface between oil and culture medium (18 µm z-axis) are shown.