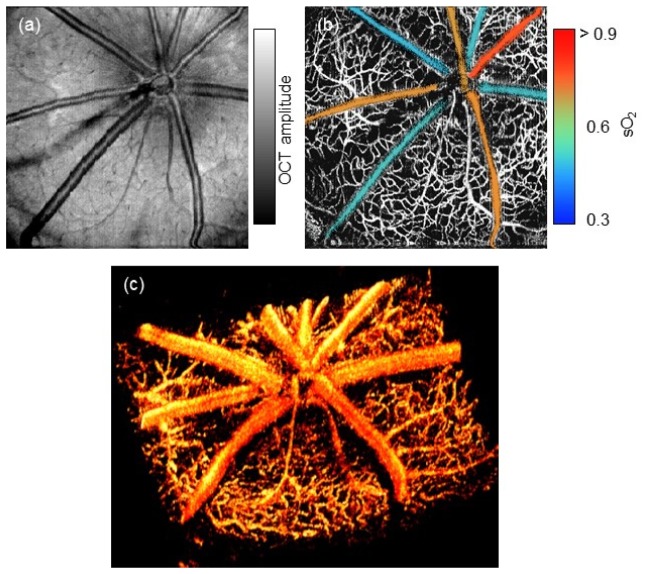
Fig. 3.
In vivo imaging of a rat retina using vis-OCT. (a) and (b) are en face projection of amplitude and motion enhanced microangiography, respectively. In the microangiography map, each major retinal arterioles and venules are color-encoded based on the measured sO2 value. (c) A three dimensional rendering of rat retinal microvasculature. See Visualization 1 (4.8MB, AVI) for the fly-through en face microangiogram.

