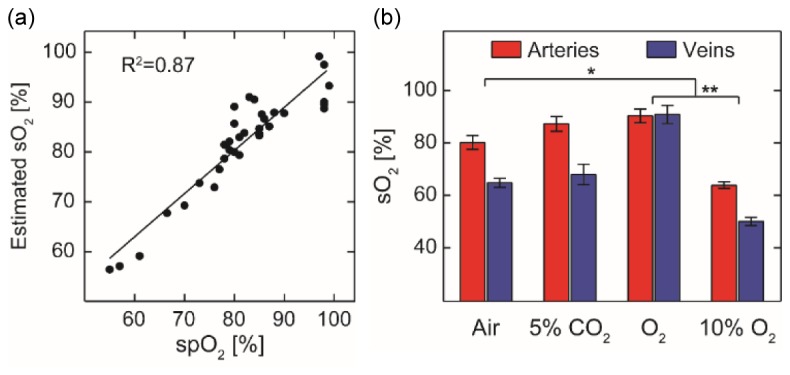
Fig. 4.

Measurement of absolute sO2 values in the retinal circulation in vivo. (a) Measured arterial sO2 calibrated against pulse oximetry readings (R2 = 0.87) from n = 8 rats. Black line is the linear regression of the data (b) Measured sO2 of major retinal arteries and venues upon changes of inhalation gas mixtures (n = 8 for each bar). Error bar = S.E.M. *: p < 0.05. **: p < 0.01.
