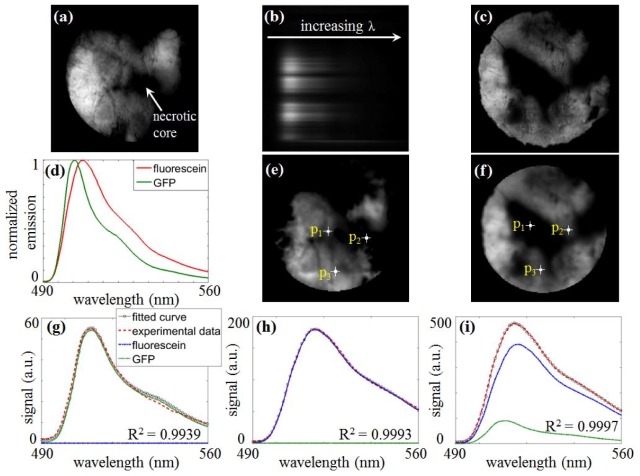
Fig. 4.
Hyperspectral fluorescence imaging results. (a) A fluorescence image of GFP. (b) A single dispersion image of a line through the center of MWC. (c) A fluorescence image after fluorescein injection. (d) Normalized emission spectra of fluorescein and GFP. (e-f) Maps of CGFP and Cfl derived from spectral unmixing. (g-i) Plots show the measured data, fitted curves and decomposed spectral components at three locations marked p1-p3 in (e) and (f).

