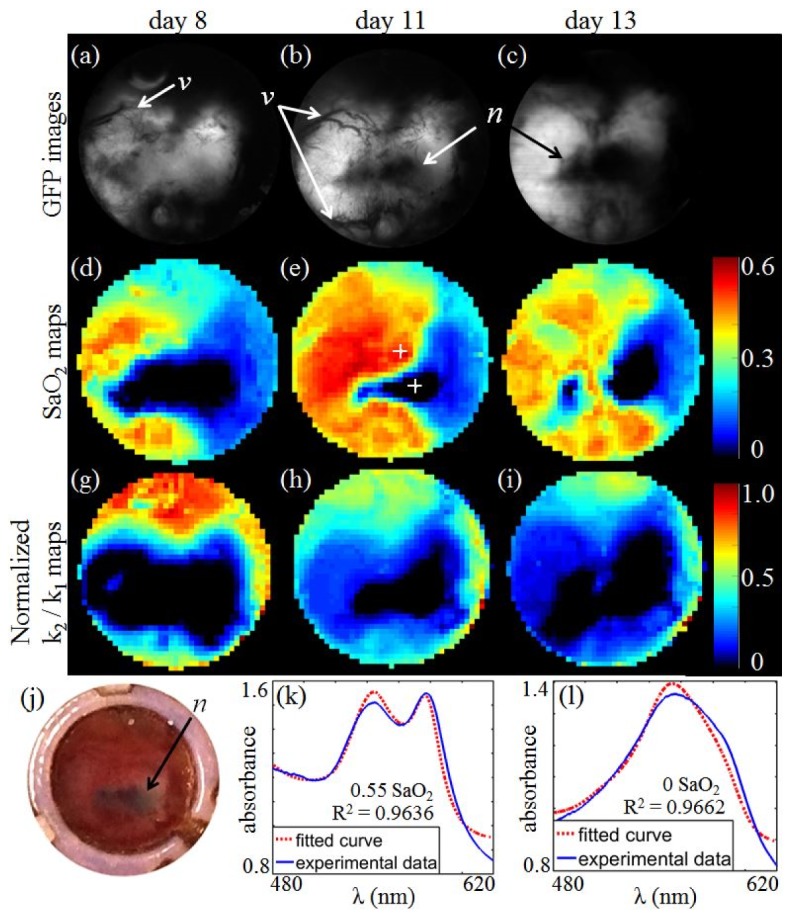
Fig. 5.

Hyperspectral reflectance imaging to measure SaO2 in the MWC model. (a-c) are GFP images at days 8, 11 and 13 after cell inoculation. Aberrant vasculature and necrosis are marked as “v” and “n” respectively. (d-f) SaO2 maps of the MWC at corresponding days. (g-i) Normalized maps of k2/k1 coefficient (see Eq. (2)), which are related to fat content. (j) A picture of the MWC taken at day 11 which shows the marked necrotic region being darker than surrounding tissue. (k-l) Plots of measured and fitted absorbance curves at two different locations marked with crosshairs in (e).
