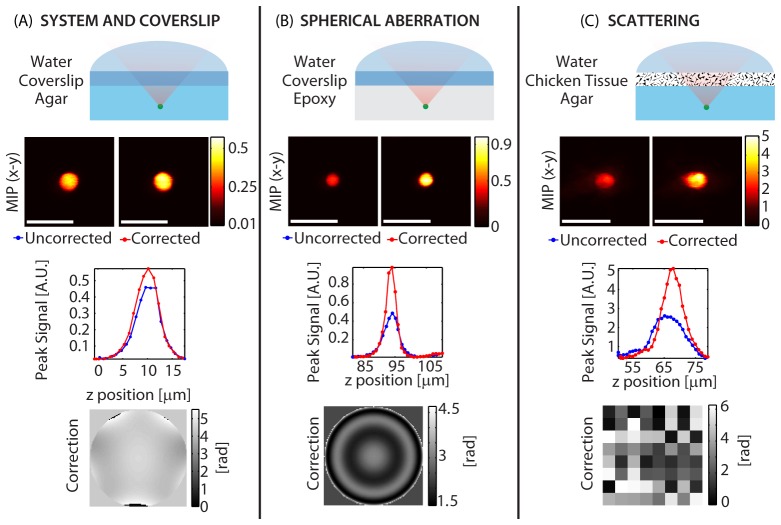
Fig. 5.
Comparison of optimizations performed on 4 micron diameter beads embedded in various samples: The functions were picked to match the expected wavefront error. (A) System and coverslip correction. (B) Spherical aberration correction. (C) Scattering induced by chicken tissue. Axial stacks were acquired with and without the correction applied. Each column shows the sample schematic (row 1), maximum intensity projection to the x-y plane (MIP-xy) (row 2), peak signal variation with depth (row 3) and the correction applied to the LCSLM (row 4). λ = 755 nm (A, B) and λ = 850 nm (C). Configuration: Sweeping Beam (A,B) and Standing Beam (C). Scale bars = 10 µm.

