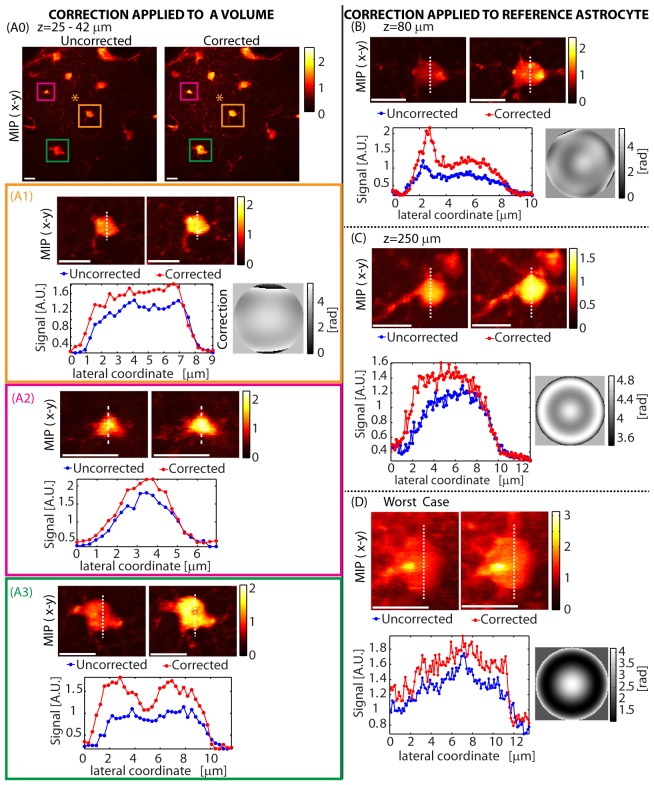
Fig. 7.
In-vivo corrections using astrocytes at various depths: (A) A correction was performed using the astrocyte at the center of the field of view (indicated by a ‘*’ in A0). An axial stack of this field of view (approximately 120x120x19 µm) was then acquired with and without this correction. (A0) shows the max-intensity projection to the x-y plane (MIP-xy). (A1-A3) shows the MIP–xy and signal cross sections of three astrocytes in the volume located at z≈35 µm, z≈40 µm and z≈25 µm respectively, showing that the correction remains valid across the volume. In (B,C,D), a correction was performed on the same astrocyte as imaged, for a range of astrocytes at different depths. The final LCSLM correction pattern is shown next to the signal variation plot. Function sets used for optimization were: (A) Z16, (B) Z16 followed by ZR, (C) ZR and (D) ZR. Optimization time was (A) 19 seconds, (B) 37 seconds, (C) 6 seconds and (D) 6 seconds. λ = 850 nm. Configuration: Sweeping Beam. Scale bars = 10 µm.

