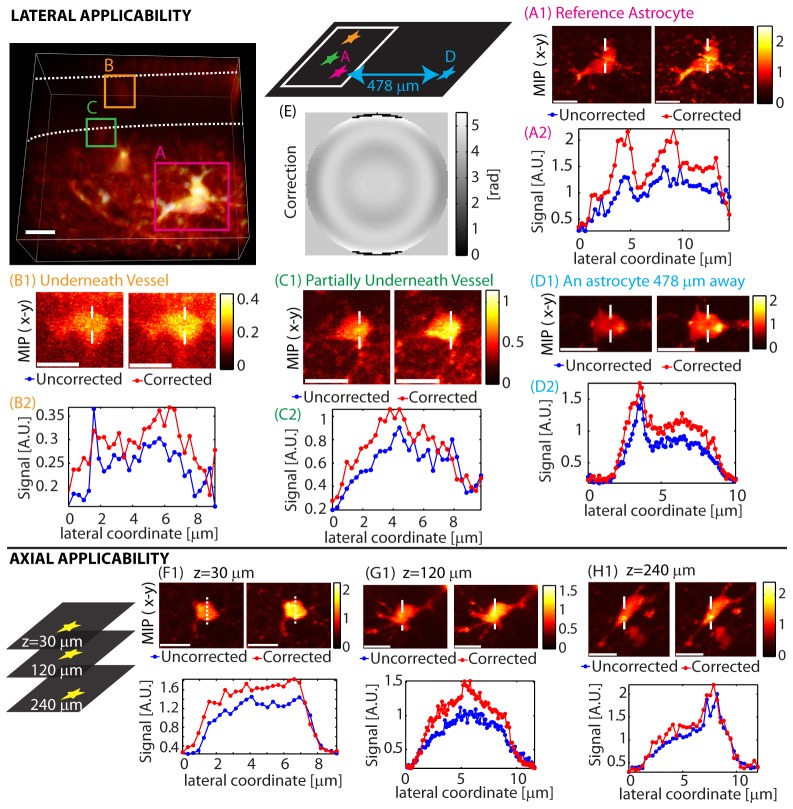
Fig. 8.
Spatial applicability of a single correction. Lateral: The image on the top left is a 3-D rendering showing the imaged volume indicating three astrocytes and a blood vessel (outlined in dashed white lines). A correction generated using an astrocyte (A) was applied to the same astrocyte (A), two nearby astrocytes (hidden by a vessel) (B,C), and another astrocyte ~478 µm away laterally (D). The corresponding correction is (E). Optimization time was 22 seconds. Axial: A correction generated at z = 30 µm was applied at two other depths (G,H). The corresponding correction is shown in Fig. 7(A). λ = 850 nm. Configuration: Sweeping Beam. Scale bars = 10 µm.

