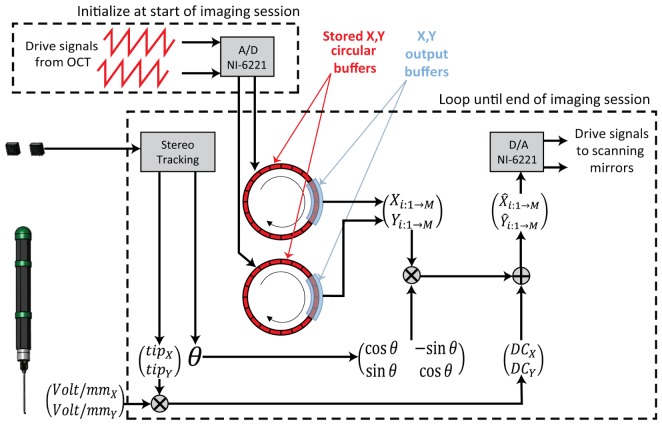
Fig. 5.
Schematic of stereo vision tracked iOCT. Drive signals from iOCT were sampled for 1 s and stored in circular buffers. Output buffers were continuously read from circular buffers at ~30 Hz. The output samples were rotated and translated by the computed instrument pose from the stereo vision system by applying voltage and field rotation offsets. Finally, tracked scanner trajectories were output to each corresponding galvanometer scanner.

